
中国资源型城市房价时空变化与影响因素分析
|
湛东升(1987- ),男,安徽寿县人,博士,副教授,硕士生导师,主要从事宜居城市与区域发展研究。E-mail: zhands@126.com |
收稿日期: 2019-09-06
要求修回日期: 2019-11-11
网络出版日期: 2021-02-28
基金资助
教育部哲学社会科学研究重大课题攻关项目(18JZD033)
国家自然科学基金项目(41671166)
国家自然科学基金项目(42001120)
版权
Spatiotemporal change and influencing factors of resource-based cities' housing prices in China
Received date: 2019-09-06
Request revised date: 2019-11-11
Online published: 2021-02-28
Copyright
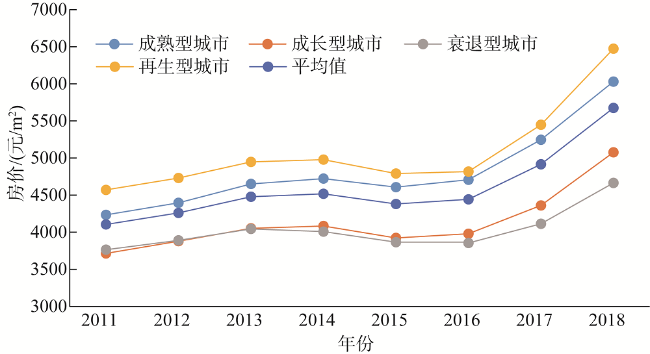
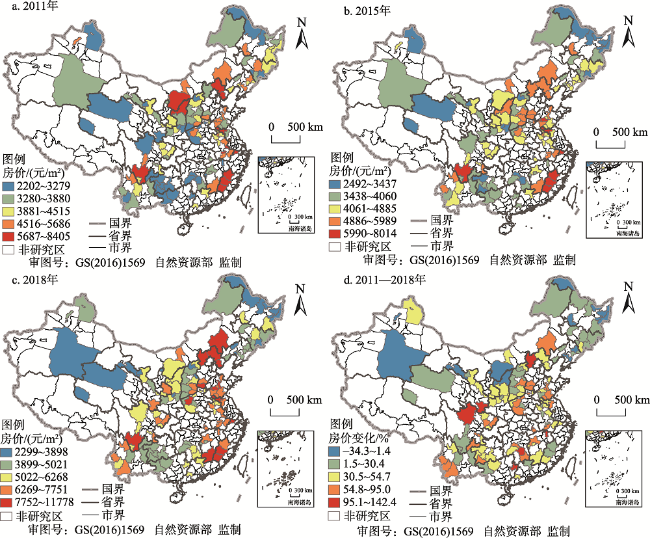
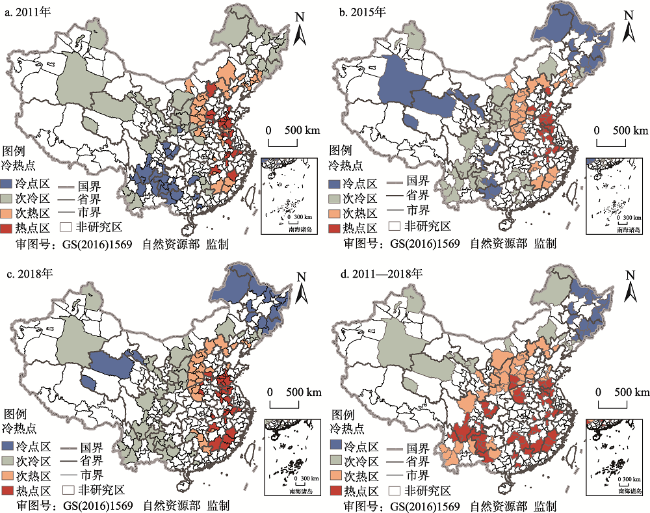
基于禧泰数据库的全国城市二手房价监测数据,利用描述统计和GIS空间分析方法详细分析了2011—2018年126个中国资源型城市房价时空变化特征,并采用空间杜宾模型进一步揭示了其影响因素。研究结果表明:(1)2011年和2018年中国资源型城市平均房价分别为4105元/m2和5675元/m2,再生型城市、成熟型城市、成长型城市和衰退型城市的平均房价依次递减;(2)2011—2018年中国资源型城市平均房价呈现出波动上升的态势,房价增长率为38.2%,远低于全国城市平均房价增长幅度55.3%,且不同类型资源型城市房价的增长幅度有所差异,以成熟型和再生型城市的房价增幅相对较大;(3)中国资源型城市房价和变化存在显著的空间集聚特征,房价热点区主要集中在东部地区和中部地区城市,房价冷点区主要以东北地区和西部地区城市为主;(4)空间杜宾模型显示,人均GDP、人均住房开发投资、多样化指数、专业化指数和工业废水排放强度是影响中国资源型城市房价空间差异的主要因素。
湛东升 , 吴倩倩 , 余建辉 , 张文忠 , 张娟锋 . 中国资源型城市房价时空变化与影响因素分析[J]. 自然资源学报, 2020 , 35(12) : 2888 -2900 . DOI: 10.31497/zrzyxb.20201206
Based on national second-hand housing price monitoring data from CityRE database, spatiotemporal change characteristics of 126 resource-based cities' housing prices in China during 2011 to 2018 are analyzed in detail using descriptive statistics and GIS spatial analysis method, and its influencing factors are further revealed by Spatial Durbin Model. The results show that: (1) The average housing prices of resource-based cities in 2011 and 2018 are 4105 and 5675 yuan per square metre respectively, and average housing prices of regenerative cities, mature cities, growing cities and declining cities decrease in turn. (2) Average housing prices of resource-based cities in China fluctuated upward from 2011 to 2018 with a growth rate of 38.2%, which is lower than that of the national average housing prices. In addition, the growth rate of housing price varies across different types of resource-based cities, while mature and regenerative cities have relatively large values. (3) There are significant spatial agglomeration characteristics of housing prices and the price change in resource-based cities. Hot spots of housing prices are mainly concentrated in the eastern and central regions, while cold spots of housing prices are mainly distributed in the northeastern and western regions. (4) Spatial Durbin Model suggests that per capita GDP, per capita investment in housing development, diversity index, specialization index and industrial wastewater discharge intensity are the main factors affecting housing prices' spatial differentiation of resource-based cities in China.
表1 不同类型资源型城市的特征描述Table 1 Descriptive characteristics of different types of resource-based cities |
| 类型 | 资源开发阶段 | 资源保障能力 | 社会经济发展 |
|---|---|---|---|
| 成长型城市 | 上升阶段 | 潜力大 | 后劲足 |
| 成熟型城市 | 稳定阶段 | 强 | 水平较高 |
| 衰退型城市 | 趋于枯竭 | 弱 | 滞后 |
| 再生型城市 | 基本摆脱资源依赖 | 弱 | 步入良性发展轨道 |
表2 中国资源型城市房价及其变化的全局空间自相关结果Table 2 Globe Moran's I of resource-based cities' housing prices and its change in China |
| 变量 | Moran's I | Z值 | P值 |
|---|---|---|---|
| 2011年 | 0.085 | 3.2305 | 0.001 |
| 2012年 | 0.114 | 4.2119 | 0.000 |
| 2013年 | 0.119 | 4.3074 | 0.000 |
| 2014年 | 0.133 | 4.7191 | 0.000 |
| 2015年 | 0.165 | 5.8498 | 0.000 |
| 2016年 | 0.206 | 7.3935 | 0.000 |
| 2017年 | 0.246 | 9.1191 | 0.000 |
| 2018年 | 0.273 | 10.0863 | 0.000 |
| 2011—2018年变化值 | 0.163852 | 5.9950 | 0.000 |
表3 中国资源型城市房价解释变量选择及其预期影响Table 3 Explanatory variables and their expected direction of resource-based cities' housing prices in China |
| 维度 | 解释变量 | 变量代码 | 预期影响 |
|---|---|---|---|
| 供给需求 | 人口密度/(人/km2) | PD | + |
| 人均住房开发投资/元 | PHI | - | |
| 经济发展 | 人均GDP/元 | PGDP | + |
| 第三产业比例/% | TIR | + | |
| 产业集聚 | 采矿业专业化 | SI | - |
| 多样化 | DI | + | |
| 人居环境 | 每万人普通小学/个 | PRI | + |
| 每万人医院数/个 | HOS | + | |
| 每万人拥有公共汽车/辆 | BUS | + | |
| 人均公园绿地面积/km2 | GA | + | |
| 建成区绿化率/% | GR | + | |
| 环境污染 | 单位GDP工业废水排放量/(t/万元) | IW | - |
| 单位GDP工业二氧化硫排放量/(t/亿元) | SO2 | - | |
| 单位GDP工业烟(粉)尘排放量/(t/亿元) | IS | - |
注:“+”和“-”分别表示解释变量的预期影响方向为正向影响和负向影响。 |
表4 空间杜宾模型的参数估计结果Table 4 Parameter estimate result of Spatial Durbin Model |
| 解释变量 | Main | t | WX | t |
|---|---|---|---|---|
| PD | -0.0587 | -1.26 | -0.2430 | -1.13 |
| PHI | 0.0380** | 2.25 | 0.0882* | 1.92 |
| PGDP | 0.0570** | 2.26 | 0.0660 | 0.43 |
| TIR | 0.0004 | 0.26 | -0.0071 | -0.79 |
| SI | -0.0081** | -2.40 | 0.0613** | 2.05 |
| DI | -0.0239* | -1.80 | -0.1420* | -1.67 |
| PRI | 0.0059 | 1.38 | 0.0278 | 1.50 |
| HOS | 0.0026 | 1.26 | -0.0219 | -1.01 |
| BUS | 0.0006 | 0.60 | -0.0234** | -2.13 |
| GA | 0.0019 | 0.34 | -0.0028 | -0.15 |
| GR | 0.0001 | -0.20 | 0.0067** | 2.36 |
| IW | -0.0018** | -2.03 | 0.0007 | 0.07 |
| SO2 | 0.0000 | -0.17 | 0.0008 | 1.57 |
| IS | 0.0000 | 0.81 | 0.0000 | -0.22 |
| ρ (W×HP) | 0.498*** | Likelihood L | 1080.9237 |
注:*、**、***分别表示0.1、0.05和0.01置信水平下显著,下同;Main为主效应,WX为空间溢出效应。 |
表5 解释变量的直接效应与间接效应估计Table 5 Direct and indirect effect estimates of explanatory variables |
| 解释变量 | 直接效应 | 间接效应 | 总效应 | |||||
|---|---|---|---|---|---|---|---|---|
| 系数 | P值 | 系数 | P值 | 系数 | P值 | |||
| PD | -0.0595 | 0.175 | -0.5440 | 0.276 | -0.6035 | 0.225 | ||
| PHI | 0.0413** | 0.014 | 0.2270* | 0.091 | 0.2683** | 0.042 | ||
| PGDP | 0.0583** | 0.016 | 0.1830 | 0.596 | 0.2413 | 0.487 | ||
| TIR | 0.0003 | 0.87 | -0.0152 | 0.469 | -0.0149 | 0.481 | ||
| SI | -0.0068** | 0.050 | 0.1160 | 0.134 | 0.1092 | 0.161 | ||
| DI | -0.0276** | 0.031 | -0.3170 | 0.115 | -0.3446* | 0.089 | ||
| PRI | 0.0066 | 0.141 | 0.0640 | 0.167 | 0.0706 | 0.135 | ||
| HOS | 0.0022 | 0.321 | -0.0410 | 0.419 | -0.0388 | 0.451 | ||
| BUS | 0.0002 | 0.853 | -0.0490* | 0.064 | -0.0488* | 0.071 | ||
| GA | 0.0022 | 0.693 | -0.0071 | 0.848 | -0.0049 | 0.893 | ||
| GR | 0.0001 | 0.925 | 0.0139** | 0.031 | 0.0140** | 0.036 | ||
| IW | -0.0018* | 0.081 | 0.0003 | 0.99 | -0.0015 | 0.925 | ||
| SO2 | 0.0000 | 0.932 | 0.0016 | 0.14 | 0.0016 | 0.148 | ||
| IS | 0.0000 | 0.458 | 0.0000 | 0.859 | 0.0000 | 0.889 | ||
| [1] |
余建辉, 张文忠, 王岱. 中国资源枯竭城市的转型效果评价. 自然资源学报, 2011,26(1):11-21.
[
|
| [2] |
余建辉, 张文忠, 王岱, 等. 资源枯竭城市转型成效测度研究. 资源科学, 2013,35(9):1812-1820.
[
|
| [3] |
汤庆园, 徐伟, 艾福利. 基于地理加权回归的上海市房价空间分异及其影响因子研究. 经济地理, 2012,32(2):52-58.
[
|
| [4] |
宋伟轩, 陈艳如, 孙洁, 等. 长三角一体化区域城市房价空间分异的模式与效应. 地理学报, 2020,75(10):2109-2125.
[
|
| [5] |
|
| [6] |
|
| [7] |
|
| [8] |
|
| [9] |
王良健, 颜蕾, 李中华, 等. 土地供应计划对房价的传导机制研究. 自然资源学报, 2015,30(11):1823-1833.
[
|
| [10] |
李峰清, 赵民. 关于多中心大城市住房发展的空间绩效: 对重庆市的研究与延伸讨论. 城市规划学刊, 2011, (3):8-19.
[
|
| [11] |
|
| [12] |
|
| [13] |
|
| [14] |
|
| [15] |
|
| [16] |
|
| [17] |
|
| [18] |
|
| [19] |
|
| [20] |
王劲峰, 廖一兰, 刘鑫. 空间数据分析教程. 北京: 科学出版社, 2010.
[
|
| [21] |
赵雪雁, 陈欢欢, 马艳艳, 等. 2000—2015年中国农村能源贫困的时空变化与影响因素. 地理研究, 2018,37(6):1115-1126.
[
|
| [22] |
余建辉, 李佳洺, 张文忠. 中国资源型城市识别与综合类型划分. 地理学报, 2018,73(4):677-687.
[
|
| [23] |
王洋, 王德利, 王少剑. 中国城市住宅价格的空间分异格局及影响因素. 地理科学, 2013,33(10):1157-1165.
[
|
| [24] |
王少剑, 王洋, 蔺雪芹, 等. 中国县域住宅价格的空间差异特征与影响机制. 地理学报, 2016,71(8):1329-1342.
[
|
| [25] |
刘嘉毅, 陶婷芳, 夏鑫. 产业结构变迁与住宅价格关系实证研究: 来自中国内地的经验分析. 财经研究, 2014,40(3):73-84.
[
|
| [26] |
夏凯丽, 田曦, 应瑞瑶. 产业集聚对房价上涨影响机制的经验分析. 统计与决策, 2017, (11):128-132.
[
|
| [27] |
徐辉, 杨烨. 人口和产业集聚对环境污染的影响: 以中国的100个城市为例. 城市问题, 2017, (1):53-60.
[
|
| [28] |
韩艳红, 尹上岗, 李在军. 长三角县域房价空间分异格局及其影响因素分析. 人文地理, 2018,33(6):87-95.
[
|
| [29] |
戴其文, 姚意旗, 张晓奇, 等. 环境对城市房价影响研究述评与展望. 资源科学, 2019,41(4):627-642.
[
|
| [30] |
|
| [31] |
|
| [32] |
董纪昌, 张欣, 周克成, 等. 基于空间计量的我国房地产价格集聚与差异研究. 系统工程理论与实践, 2016,36(4):875-883.
[
|
| [33] |
赵林, 韩增林, 马慧强. 东北地区城市人居环境质量时空变化分析. 地域研究与开发, 2013,32(2):73-78.
[
|
/
| 〈 |
|
〉 |