
环境约束下的福建省城市建设用地利用效率及驱动因素
|
梁建飞(1993- ),女,广东湛江人,硕士,主要从事土壤与土地资源研究。E-mail: 1156887101@qq.com |
收稿日期: 2019-05-08
要求修回日期: 2019-07-18
网络出版日期: 2021-02-28
基金资助
国家自然科学基金项目(41771136)
福建省科技重大专项项目(2012NZ0002)
版权
Research on the land-use efficiency and driving factors of urban construction in Fujian province under environmental constraints
Received date: 2019-05-08
Request revised date: 2019-07-18
Online published: 2021-02-28
Copyright
研究环境约束下的城市建设用地利用效率地区差异特征及其驱动机理,对于引导城市建设用地高效利用、缓解快速城镇化进程中经济社会发展与生态环境之间的矛盾、实现区域协调发展具有重要现实意义。将环境污染作为非期望产出纳入城市建设用地利用效率评价体系,运用非期望产出SE-SBM模型、变异系数、GML指数和灰色关联度模型,系统研究2006—2016年福建省城市建设用地利用效率的时空分异特征、动态趋势演变及其驱动因素。研究表明:(1)2006—2016年福建城市建设用地利用效率总体呈正弦函数式样波动,2012—2016年投入产出效率始终位于有效前沿面。各地区效率差异明显,效率的高低与经济发展水平之间并非是正相关关系。(2)空间格局整体上呈现东部沿海地区的效率值高于西部内陆地区的分布态势,形成明显的集群效应。漳州虽属于东南部沿海地区,但2016年其效率值仍处于无效状态,未发生根本性转变,这进一步说明高效率城市的辐射带动作用较弱。(3)福建全要素生产率表现为正弦函数式样增长态势,整体发展趋势向好。技术进步引起的集聚规模效应是造成地区全要素生产增长率差异的主要原因,技术因素是缩小地区间全要素增长率差距的关键。(4)城镇化水平、生态投入、政府规制、耕地资源禀赋、科技研发投入和产业结构高级化是影响福建省城市建设用地利用效率时空分异与演变的主要驱动因素。
梁建飞 , 陈松林 . 环境约束下的福建省城市建设用地利用效率及驱动因素[J]. 自然资源学报, 2020 , 35(12) : 2862 -2874 . DOI: 10.31497/zrzyxb.20201204
It is of great practical significance to explore the regional difference characteristics and driving mechanism of the utilization efficiency of construction land under environmental constraints. The purpose is to guide the efficient utilization of urban construction land, alleviate the contradiction between social and economic development and ecological environment in the process of rapid urbanization, as well as achieve regional coordinated development. Taking environmental pollution as an unexpected output into the evaluation system, we systematically studied the spatiotemporal differentiation characteristics, dynamic trend evolution and driving factors of urban construction land use efficiency in Fujian province from 2006 to 2016. Models adopted in this analysis include the non-expected output SE-SBM model, coefficient of variation, and GML index and gray relational model. The results showed that: (1) During 2006-2016, the utilization efficiency of urban construction land in Fujian fluctuated in a sinusoidal pattern. The input-output efficiency had always been put at the effective frontier from 2012 to 2016. It is easy to find the differences of efficiency values between regions. It can also be found that there exists a non-positive correlation between efficiency and economic development level. (2) The spatial pattern suggests that the efficiency of the eastern coastal region is higher than that of the western inland areas, which forms an obvious cluster effect. Although Zhangzhou city is located in the southeastern coastal area, its efficiency value in 2016 was still in an invalid state without a fundamental change, which further illustrates that the radiation driving role of high-efficiency cities is weak. (3) The TFP of Fujian shows a sinusoidal growth trend, and the overall development trend is good. The agglomeration scale effect caused by technological progress is the main reason for the variance in the growth rate of regional TFP. Technological factor is the key to narrow the gap in the growth rate of regional TFP. (4) Urbanization level, ecological input, government regulation, cultivated land resource endowment, R&D investment in science and technology, as well as the advanced industrial structure are the main driving factors affecting the spatiotemporal differentiation and evolution of urban construction land-use efficiency in Fujian province.
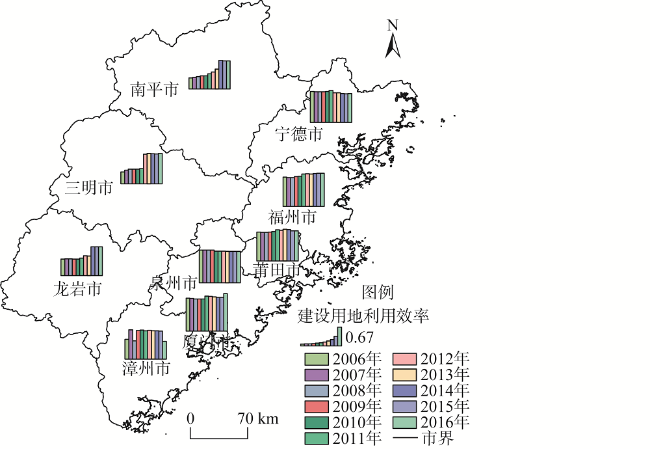
表1 2006—2016年福建省城市建设用地利用效率Table 1 The urban construction land use efficiencyin Fujian province from 2006 to 2016 |
| 地区 | 2006年 | 2007年 | 2008年 | 2009年 | 2010年 | 2011年 | 2012年 | 2013年 | 2014年 | 2015年 | 2016年 |
|---|---|---|---|---|---|---|---|---|---|---|---|
| 福州市 | 1.039 | 1.028 | 1.027 | 1.066 | 1.072 | 1.157 | 1.159 | 1.152 | 1.175 | 1.183 | 1.184 |
| 厦门市 | 1.172 | 1.160 | 1.142 | 1.144 | 1.144 | 1.243 | 1.234 | 1.217 | 1.200 | 1.195 | 1.335 |
| 莆田市 | 1.021 | 1.020 | 1.015 | 1.024 | 1.041 | 1.112 | 1.089 | 1.124 | 1.117 | 1.069 | 1.068 |
| 三明市 | 0.418 | 0.483 | 0.520 | 0.515 | 0.522 | 0.534 | 1.053 | 1.074 | 1.067 | 1.062 | 1.075 |
| 泉州市 | 1.164 | 1.162 | 1.163 | 1.161 | 1.131 | 1.128 | 1.125 | 1.122 | 1.119 | 1.114 | 1.114 |
| 漳州市 | 0.702 | 1.044 | 0.651 | 1.018 | 1.036 | 1.004 | 1.027 | 1.012 | 1.006 | 1.001 | 0.635 |
| 南平市 | 0.395 | 0.415 | 0.438 | 0.472 | 0.469 | 0.545 | 0.604 | 0.704 | 1.014 | 1.003 | 1.000 |
| 龙岩市 | 0.578 | 0.593 | 0.595 | 0.579 | 0.584 | 0.618 | 0.698 | 0.690 | 1.025 | 1.024 | 1.018 |
| 宁德市 | 1.105 | 1.092 | 1.090 | 1.092 | 1.098 | 1.139 | 1.053 | 1.051 | 1.026 | 1.021 | 1.023 |
| 福建省 | 0.844 | 0.889 | 0.849 | 0.897 | 0.900 | 0.942 | 1.005 | 1.016 | 1.083 | 1.075 | 1.050 |
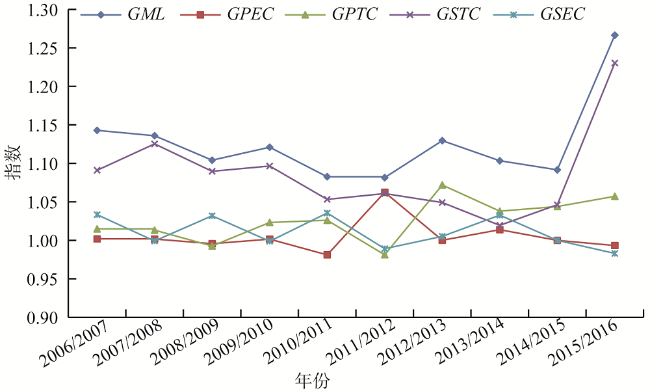
表2 2006—2016年福建省各城市GML指数及其分解因素均值Table 2 GML index and its decomposition factor in different cities of Fujian province from 2006 to 2016 |
| 地区 | GML指数 | 纯效率变化 (GPEC) | 纯技术进步 (GPTC) | 技术规模变化 (GSTC) | 规模效率变化 (GSEC) |
|---|---|---|---|---|---|
| 福州市 | 1.105 | 1.000 | 1.072 | 1.030 | 1.000 |
| 厦门市 | 1.080 | 1.000 | 1.002 | 1.083 | 1.000 |
| 莆田市 | 1.145 | 1.000 | 1.001 | 1.147 | 1.000 |
| 三明市 | 1.150 | 1.024 | 1.013 | 1.088 | 1.025 |
| 泉州市 | 1.098 | 1.000 | 1.072 | 1.024 | 1.000 |
| 漳州市 | 1.109 | 0.994 | 1.051 | 1.074 | 0.997 |
| 南平市 | 1.172 | 1.026 | 1.003 | 1.106 | 1.040 |
| 龙岩市 | 1.141 | 1.002 | 1.021 | 1.090 | 1.035 |
| 宁德市 | 1.134 | 1.000 | 1.000 | 1.133 | 1.000 |
| 均值 | 1.126 | 1.005 | 1.026 | 1.086 | 1.011 |
| 差异系数 | 0.025 | 0.011 | 0.028 | 0.036 | 0.016 |
注:差异系数测算参考文献 [3, 5]。 |
表3 城市建设用地利用效率与各影响因素的灰色关联度及关联等级Table 3 Grey relational degree and relational grade of each influence factor and construction land use efficiency in Fujian province |
| 影响因素 | 变量说明 | 灰色关联度 | 关联等级 |
|---|---|---|---|
| 经济发展水平 | 人均GDP/万元 | 0.6352 | 中 |
| 产业结构高级化 | 产业结构升级指数 | 0.7983 | 强 |
| 政府规制 | 政府财政支出占地区GDP比例/% | 0.8445 | 强 |
| 城镇化水平 | 城镇人口比例/% | 0.9211 | 强 |
| 人地关系 | 人口密度/(人/km2) | 0.6800 | 中 |
| 土地投资强度 | 单位建设用地面积的固定资本投入/(亿元/km2) | 0.7134 | 中 |
| 耕地资源禀赋 | 人均耕地面积/hm2 | 0.8248 | 强 |
| 对外依赖程度 | 进出口总值占地区GDP比例/% | 0.7102 | 中 |
| 科技研发投入 | 科学技术投入占地区GDP比例/% | 0.8151 | 强 |
| 生态投入 | 建成区绿化覆盖率/% | 0.8659 | 强 |
注:参考文献[4],将灰色关联度划分为三类:[0, 0.35] 弱关联度;(0.35, 0.75] 中关联度;(0.75, 1] 强关联度。 |
| [1] |
|
| [2] |
吴得文, 毛汉英, 张小雷, 等. 中国城市土地利用效率评价. 地理学报, 2011,66(8):1111-1121.
[
|
| [3] |
杨清可, 段学军, 叶磊, 等. 基于SBM-Undesirable模型的城市土地利用效率评价: 以长三角地区16城市为例. 资源科学, 2014,36(4):712-721.
[
|
| [4] |
张立新, 朱道林, 杜挺, 等. 基于DEA模型的城市建设用地利用效率时空格局演变及驱动因素. 资源科学, 2017,39(3):418-429.
[
|
| [5] |
樊鹏飞, 冯淑怡, 苏敏, 等. 基于非期望产出的不同职能城市土地利用效率分异及驱动因素探究. 资源科学, 2018,40(5):946-957.
[
|
| [6] |
|
| [7] |
|
| [8] |
|
| [9] |
华吉庆, 叶长盛. 基于DEA的广东省城市土地利用效率及其时空分异特征. 水土保持研究, 2018,25(4):283-288.
[
|
| [10] |
卢新海, 匡兵, 周敏. 城市建设用地利用效率的空间非均衡及影响因素. 中国人口·资源与环境, 2016,26(11):745-752.
[
|
| [11] |
张雅杰, 金海. 长江中游地区城市建设用地利用效率及驱动机理研究. 资源科学, 2015,37(7):1384-1393.
[
|
| [12] |
李永乐, 舒帮荣, 吴群. 中国城市土地利用效率: 时空特征、地区差距与影响因素. 经济地理, 2014,34(1):133-139.
[
|
| [13] |
林丽群, 李娜, 李国煜, 等. 基于主体功能区的福建省城镇建设用地利用效率研究. 自然资源学报, 2018,33(6):1018-1028.
[
|
| [14] |
陆砚池, 方世明. 基于SBM-DEA和Malmquist模型的武汉城市圈城市建设用地生态效率时空演变及其影响因素分析. 长江流域资源与环境, 2017,26(10):1575-1586.
[
|
| [15] |
黄晶, 马蓓蓓, 薛东前. 基于SE-DEA模型的西安市土地利用效率及优化对策. 干旱区研究, 2015,32(3):630-636.
[
|
| [16] |
范建双, 虞晓芬, 周琳. 南京市土地利用结构碳排放效率增长及其空间相关性. 地理研究, 2018,37(11):2177-2192.
[
|
| [17] |
王希睿, 许实, 杨兴典, 等. 江苏省建设用地利用效率和全要素生产率的时空差异分析. 中国土地科学, 2015,29(5):77-83.
[
|
| [18] |
徐慧敏, 胡守庚, 李熙. 中国建设用地环境效率时空演变及其影响因素. 应用科学学报, 2019,37(1):73-86.
[
|
| [19] |
|
| [20] |
|
| [21] |
韩增林, 夏康, 郭建科, 等. 基于Global-Malmquist-Luenberger指数的沿海地带陆海统筹发展水平测度及区域差异分析. 自然资源学报, 2017,32(8):1271-1285.
[
|
| [22] |
|
| [23] |
|
| [24] |
|
| [25] |
|
| [26] |
杨皓然, 吴群. 碳排放视角下的江苏省土地利用转型生态效率研究: 基于混合方向性距离函数. 自然资源学报, 2017,32(10):1718-1730.
[
|
| [27] |
贝涵璐. 建设用地利用效率时空差异及其与城镇化质量的耦合关系. 杭州: 浙江大学, 2016.
[
|
| [28] |
张军, 吴桂英, 张吉鹏. 中国省际物质资本存量估算: 1952—2000. 经济研究, 2004, (10):35-44.
[
|
| [29] |
齐亚伟. 碳排放约束下我国全要素生产率增长的测度与分解: 基于SBM方向性距离函数和GML指数. 工业技术经济, 2013,32(5):137-146.
[
|
| [30] |
杨高升, 谢秋皓. 长江经济带绿色水资源效率时空分异研究: 基于SE-SBM与ML指数法. 长江流域资源与环境, 2019,28(2):349-358.
[
|
| [31] |
温丽华. 灰色系统理论及其应用. 哈尔滨: 哈尔滨工程大学, 2003.
[
|
| [32] |
高远东, 张卫国, 阳琴. 中国产业结构高级化的影响因素研究. 经济地理, 2015,35(6):96-101, 108.
[
|
/
| 〈 |
|
〉 |