其他研究论文

基于TRMM降尺度和MODIS数据的综合干旱监测模型构建

  • 余灏哲 , 1, 2, 3 ,
  • 李丽娟 , 2 ,
  • 李九一 2
展开
  • 1.陕西理工大学历史文化与旅游学院, 汉中 723000
  • 2.中国科学院地理科学与资源研究所陆地水循环及地表过程重点实验室,北京 100101
  • 3.中国科学院大学资源与环境学院,北京 100049
李丽娟(1961- ),女,吉林吉林人,博士,研究员,博士生导师,研究方向为水文与水资源。E-mail:

余灏哲(1992- ),男,陕西汉中人,博士,讲师,研究方向为水文水资源与区域可持续发展。E-mail:

收稿日期: 2019-06-27

  要求修回日期: 2019-11-24

  网络出版日期: 2020-12-28

基金资助

国家重点研发计划项目(2016YFC0401402-04,2016YFC0401307)

Establishment of comprehensive drought monitoring model based on downscaling TRMM and MODIS data

  • YU Hao-zhe , 1, 2, 3 ,
  • LI Li-juan , 2 ,
  • LI Jiu-yi 2
Expand
  • 1. School of History Culture and Tourism, Shaanxi University of Technology, Hanzhong 723000, Shaanxi, China
  • 2. Key Laboratory of Water Cycle and Related Land Surface Processes, Institute of Geographic Sciences and Natural Resources Research, CAS, Beijing 100101, China
  • 3. College of Resources and Environment, University of Chinese Academy of Sciences, Beijing 100049, China

Received date: 2019-06-27

  Request revised date: 2019-11-24

  Online published: 2020-12-28

Copyright

《自然资源学报》编辑部 所有

摘要

京津冀地区是我国优质冬小麦的主产区之一,但在全球气候变暖影响下,该地区干旱灾害频发,因此准确监测京津冀地区旱情既能为区域农业生产提供科学指导,又起到保障国家粮食安全等重大战略作用。综合考虑干旱发生过程中大气降水—植被生长—土壤水分盈亏等致旱因子,首先利用GWR(Geographically Weighted Regression)模型对TRMM(Tropical Rainfall Measuring Mission)3B43数据进行降尺度处理,得到1 km分辨率的降水状态参数(Precipitation Condition Index,PCI);再结合MODIS(Moderate-Resolution Imaging Spectroradiometer)数据,得到植被状态指数(Vegetation Condition Index,VCI)、温度状态指数(Temperature Condition Index,TCI),最后基于多元回归模型构建综合干旱指数(Comprehensive Drought Index,CDI),以实现对京津冀地区干旱时空监测评价。结果表明:(1)基于GWR模型与占比系数法得到的1 km空间分辨率TRMM年数据、月尺度数据,不仅在空间分辨率上相比原始TRMM数据得到很大的提升,并且数据精度也通过了检验,表明降尺度分析提高了TRMM数据对研究区降水时空特征的描述能力;(2)监测模型结果与京津冀地区所经历的干旱历程等实际旱情基本一致,并且CDI指数与标准化降水指数(Standardized Precipitation Index,SPI)做相关分析,其相关系数R在0.45~0.85之间,与作物受旱面积做相关分析,相关系数R介于在-0.81~-0.86之间,与作物标准化单产进行相关分析,其相关系数R均大于0.6,并且均通过P<0.05的显著性检验,表明本文所构建的综合干旱监测模型在京津冀地区是适用的。

本文引用格式

余灏哲 , 李丽娟 , 李九一 . 基于TRMM降尺度和MODIS数据的综合干旱监测模型构建[J]. 自然资源学报, 2020 , 35(10) : 2553 -2568 . DOI: 10.31497/zrzyxb.20201019

Abstract

The Beijing-Tianjin-Hebei region is one of the main producing areas of high-quality winter wheat in China, but drought disasters frequently occur in this region under the influence of global warming. Accurate monitoring of drought in the Beijing-Tianjin-Hebei region can not only provide scientific guidance for regional agricultural production, but also play an important strategic role in guaranteeing national food security. Therefore, in this study, drought-causing factors such as precipitation, vegetation growth, soil moisture gain and loss were considered comprehensively. Firstly, the GWR (Geographical Weighted Regression) model was used to downscale TRMM (Tropical Rainfall Measuring Mission) 3B43 data, and the Precipitation Condition Index (PCI) with a 1-km resolution was obtained. Combining MODIS (Moderate-Resolution Imaging Spectroradiometer) data, the Vegetation Condition Index (VCI), Temperature Condition Index (TCI) were obtained. Finally, a comprehensive drought index (CDI) was constructed based on the multiple regression model to achieve spatial and temporal monitoring and evaluation. The results show that: (1) The annual and monthly data of the 1-km spatial resolution TRMM based on the GWR model and proportion coefficient method have been greatly improved in spatial resolution compared with the original TRMM data, and the accuracy of the data has also passed the test, which shows that the downscaling analysis improves the description ability of TRMM data to the spatial and temporal characteristics of precipitation in the study area. (2) The results of the monitoring model are basically consistent with the drought process. The correlation coefficient (R value) between CDI and Standard Precipitation Index (SPI) was 0.45-0.85, and the correlation coefficient between CDI and drought area of crops ranged from -0.81 to -0.86, and all of them passed the very significant test of P<0.01, and the R value was greater than 0.6 between the CDI and standardized unit yield of crop (P<0.05), which indicated that the comprehensive drought monitoring model constructed by this research was applicable in the Beijing-Tianjin-Hebei region.

世界气象组织(WMO)将干旱定义为一种持续的、异常的降水短缺[1];中国气象局(CMA)将干旱界定为因水分的收与支或供与求不平衡而形成的持续的水分短缺现象[2]。当干旱的持续时间与影响范围不断渐进累积,达到对生活、生产和生态等造成危害的状态下,干旱便演化为旱灾[3]。特别是在全球气候变暖的背景下,干旱事件也明显呈增加趋势,给经济社会发展带来危害与损失。因此,对干旱进行定量监测研究迫在眉睫,具有重要的现实意义。
干旱的发生发展过程比较复杂,难以直接进行观测,通常通过构建干旱指数对干旱事件进行量化研究[4]。根据观测途径不同,基于干旱指数的监测可以划分为两种,一是利用地面实测站点的观测数据,二是利用卫星遥感数据[5]。基于站点的干旱监测起源早,发展时间长,应用比较广泛。最早可以追溯到1906年,具有代表性的有:降水距平百分比率(Pa)、帕默尔干旱指数(PDSI)、作物水分指数(CMI)、作物缺水指数(CWSI)、标准化降水量指数(SPI)、标准降水蒸散指数(SPEI[6,7]等。在《气象干旱等级》国家标准中,规定了五种单项气象干旱指标及一项综合气象干旱指数(CI),其中,CI指数同时考虑了降水和蒸发能力因子,与单纯利用降水量的干旱指数相比具有较大优越性[8,9],成为目前中国干旱监测和评估业务工作中普遍使用的方法。
基于气象站点的干旱监测在理论方法上比较成熟,但也存在一些弊端,实测站点不能完全且均匀覆盖研究区,不能得到空间上连续的干旱指数;另外,在监测机理上未考虑地表植被对干旱的响应问题。相比传统的点位监测,基于遥感的干旱监测则凸显出明显的时空优势,具有代表性的有VCITCI以及衍生出的组合类型等。例如植被健康指数(VHI)植被供水指数(VSWI[10]、温度植被干旱指数(TVDI[11]、条件温度植被干旱指数(VTCI[12]
但以上遥感干旱指数多从植被、土壤等单因素入手,并未考虑降水问题,而干旱是一种复杂的自然耦合过程,它不仅涉及植被生长和土壤水分供需等因素,大气降水也是重要的条件变量,因此对干旱监测研究时要综合考虑。热带降雨测量卫星(Tropical Rainfall Measuring Mission,TRMM)[13]的研制发射,可以得到全球热带、亚热带地区大气降水实时数据,这为干旱监测研究提供了空间上连续的降水数据支撑。国内外学者针对不同时空尺度、不同气候背景、不同下垫面的区域,利用TRMM数据及其他遥感数据进行干旱综合监测。因此本文基于TRMM和MODIS数据构建综合干旱监测模型,以京津冀地区为例,以期为区域干旱的监测评估提供一种新的途径。

1 研究方法与数据来源

1.1 研究区概况

京津冀地区是以首都北京为核心的世界级城市群,该区域人口稠密,经济发达,产业密集,是中国最具有战略地位的区域。受地理位置、地形等影响,该地区是中国降水变率较大的区域之一,丰枯年的降水量一般相差4~5倍,最极端时相差20倍,致使境内旱涝灾害频发,常有“十年九旱”之说[14]。并且京津冀地区是中国优质冬小麦主产区之一,干旱对小麦产量的波动直接影响着国家的粮食安全问题[15],因此对京津冀地区进行干旱监测显得尤为重要。然而前人对京津冀地区干旱监测研究主要局限在传统气象站点的监测[15,16,17,18,19],基于多源遥感数据的干旱时空监测在京津冀地区还比较少见。故本文基于多源遥感数据构建综合干旱监测模型,以期为京津冀地区干旱的监测评估提供科学支撑,同时也为区域干旱综合评估提供一种新的方法。研究区地理位置见图1所示。
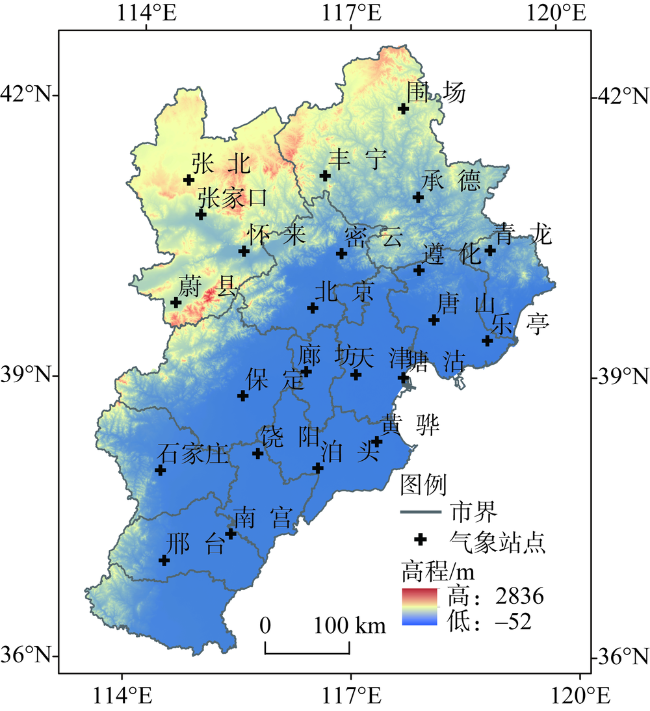
Fig. 1 Geographical location, elevation and distribution of meteorological stations in the Beijing-Tianjin-Hebei region

图1 研究区地理位置、高程与气象站点分布

1.2 数据介绍

(1)遥感数据
本文利用的遥感数据主要有:高程数据、植被指数数据、地表温度数据与TRMM降水数据。DEM数据为SRTM 90 m的高程数据,来源于CGIAR-CSI(http://srtm.csi.cgiar.org)。NDVI为MODIS 13A3的月合成植被指数数据,空间分辨率为1 km;地表温度数据为MODIS11A2的8天合成LST数据,空间分辨率为1 km。
TRMM(Tropical Rainfall Measuring Mission)降水卫星是由NASA与NASDA共同研发的全球第一颗定量监测50°N~50°S范围内的降水卫星,具有划时代的意义,TRMM 3B43产品是月尺度的降水数据,空间分辨率为0.25°。NDVI、LST、TRMM数据均来源于NASA(https://www.nasa.gov)。
(2)气象站点数据
利用中国国家气象科学数据共享平台提供的月值数据集(http://data.cma.cn),整理后得到了京津冀地区23个站点2007年1月至2016年12月的降水量、气温等数据。

1.3 基于GWR模型的统计降尺度法

近年来,基于地理加权回归(Geographically weighted regression,GWR)传递函数方法,在TRMM降尺度的研究中得到了一些尝试与验证[20,21,22]。在对TRMM进行统计降尺度研究中,通常采用的是多元线性或非线性回归方程,但这样的函数关系是固定不变的,不随空间位置的变化而变化[23,24]。而GWR方法的基本原理是通过估算每一个空间位置自变量与因变量之间的参数而建立回归方程,因此,能够充分地反映地理空间的异质性[25,26]
降水量与植被指数存在一定的相关性,因此本文利用NDVI对TRMM年降水量数据进行GWR降尺度,计算公式如下。
y i = f 0 i t + f 1 i t x 1 i + ε i t (1)
式中:yi表示TRMM中第i点的降水量(mm);x1i表示第i点的NDVI值;f表示对应的系数;t表示空间位置坐标;εi表示残差;i=1, 2, …, n,表示样本个数(个)。

1.4 月尺度TRMM降水数据分离

植被对降水具有一定的滞后效应,虽然现有的NDVI数据产品有不同的时间分辨率,可以将其与TRMM月尺度数据进行试验计算,但由于不同区域、不同类型的植被与降水量之间的滞后效应是不同的,想要精确拟合存在一定的困难,并且计算过程冗繁,结果未必理想。Duan等[27]提出了一种占比系数的方法,从已降尺度的TRMM年尺度数据中分离出月尺度数据,该方法简单易行,操作流程如下:
(1)计算各月原始TRMM降水( P mon 0 . 25 )对应该年降水( P year 0 . 25 )的占比系数( R 0 . 25 );
(2)将各月占比系数 R 0 . 25 插值到1 km,得到1 km的占比系数( R 1 );
(3)分别将 R 1 乘以降尺度后1 km年TRMM数据,从而得到各月的1 km月TRMM数据。

1.5 基于多源遥感数据的综合干旱模型构建

(1)综合气象干旱指数(CI
综合气象干旱指数(CI)是由标准化降水(SPI)与相对湿润指数(M)相集成的一种反映干旱的指标[9]。表达式如下:
CI = a Z 30 + b Z 90 + c M 30 (2)
式中:Z30表示时间尺度为30天的SPI系数,a=0.4;Z90表示时间尺度为90天的SPI系数,b=0.4;M30为30天的相对湿润指数,c=0.8。
M = ( P - PE ) / PE (3)
式中:P为月尺度的降水量(mm);PE为月尺度的潜在蒸散量(mm)。PE的计算,利用Thornthwaite法[29,30]进行计算:
E T Tho = 0 , T i 0 1.6 × L d × 10 T i I α , 0 T i 26.5 L d × ( - 415.85 + 32.24 T i - 0.43 T i 2 ) T i > 26.5 (4)
L d = d 12 × N 30 (5)
I = i = 1 12 T i 5 1.514 (6)
α = 0.49 + 0.0179 × I - 0.0000771 × I 2 + 0.000000675 × I 3 (7)
式中:ETTho表示蒸散量(mm);Ti表示月平均气温(℃);Ld表示与日长和纬度有关的修正系数;α表示经验系数;I表示热量指数;dN分别表示为各月第15日的日长,N为每月的天数(天)。
(2)植被状态参量(Vegetation Condition Index,VCI)
NDVI反映了植被的生长状态属性。当气候出现干旱时,会影响植被的正常生长,NDVI值会偏低。但是NDVI并不能直接表征干旱对植被的作用情况,另外,京津冀地区植被生长具有较明显的周期性,不同月份的NDVI不能进行直接比较。为此,对NDVI进行标准化处理,利用植被状态指数(VCI)来反映不同生长周期中植被的状态[31]。其计算公式如下:
VCI = NDVI - NDV I min NDV I max - NDV I min (8)
(3)温度状态参量(Temperature Condition Index,TCI)
伴随干旱的发生地表将会出现热应力。但地表温度随季节变化而变化,因此不能直接用于干旱监测。基于标准化植被状态参量的思路,提出标准化地温异常指数(LST[31]。计算公式如下:
TCI = LS T max - LST LS T max - LS T min (9)
(4)降水状态参量(Precipitation Condition Index,PCI)
降尺度TRMM月尺度数据具备较好的时空属性,能够真实的反映研究区降水量的时空特征,可以为干旱建模提供高精度的数据。采用类似的方法,对TRMM数据进行归一化处理,计算如下:
TCI = TRMM - TRM M min TRM M max - TRM M min (10)
(5)综合干旱模型指数(Comprehensive drought index,CDI)
区域干旱灾害的形成与发生是由致灾因子导致的,致灾因子涉及到降水量、植被状况、土壤水分状况、土地利用类型、地貌类型等,致灾因子间的相互耦合作用导致了干旱,是一个综合、复杂的过程。囿于认识水平的受限,想要定量研究每个致旱因子如何相互耦合,如何导致区域干旱难度较大,为此本文在明确致旱因子但不明晰具体耦合过程的前提下,采用半经验半机理方法来构建综合干旱模型(图2)。
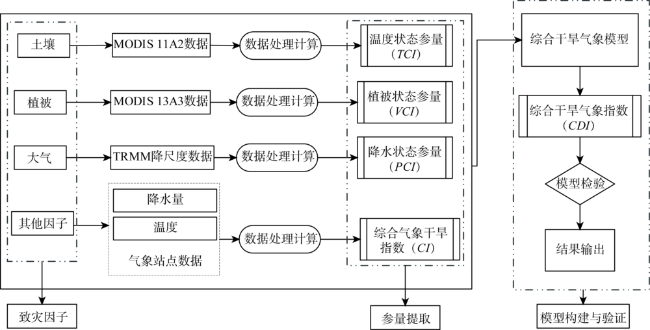
Fig. 2 Flow charts of comprehensive drought monitoring model

图2 综合干旱监测模型构建流程

首先,根据各气象站点的经纬度信息,避免单一像元值受到噪音干扰,以各气象站点所在区域为中心像元值,提取周围3×3像元值为感兴趣区域(ROI),并计算出各ROI区域的植被状态指数(VCI)、温度状态指数(TCI)、降水状态指数(PCI),以各遥感参量作为自变量;然后利用气象站点的实测数据,计算出综合气象干旱指数(CI),并作为因变量,回归数据准备完成。
其次,由于京津冀地区不同季节,其降水量、植被状态、干旱情况等变化差异较大,因此本文采用逐月回归,考虑到京津冀地区冬小麦(3-6月)、玉米(7-10月)的生长期及干旱特征,本文主要监测3月至10月10年间的干旱情况,月尺度回归方程如表1所示。
Table 1 Monthly scale regression equation from March to October in 2007-2016

表1 2007—2016年3-10月月尺度回归方程

月份 拟合方程 R2
3 CDI=-3.42+8.79×PCI-11.75×PCI2-2.83×(VCI)-13.42×TCI+7.52×TCI2 0.522
4 CDI=-1.61+7.15×PCI-2.64×PCI2-0.73×(VCI)-2.14×TCI+4.26×TCI2 0.738
5 CDI=-1.97+10.02×PCI-4.24×PCI2-0.15×(VCI)-0.05×TCI+0.21×TCI2 0.732
6 CDI=-2.37+9.92×PCI-4.33×PCI2-0.19×(VCI)-0.71×TCI-0.13×TCI2 0.728
7 CDI=-1.75+9.26×PCI+1.11×PCI2-0.59×(VCI)+1.01×TCI-0.27×TCI2 0.744
8 CDI=-1.69+9.27×PCI+1.14×PCI2-0.58×(VCI)+0.29×TCI+1.16×TCI2 0.762
9 CDI=-1.68+5.39×PCI-0.561×PCI2+0.03×(VCI)-0.13×TCI+0.41×TCI2 0.703
10 CDI=-1.02+8.43×PCI-0.71×PCI2-0.23×(VCI)-3.38×TCI+3.70×TCI2 0.820
最后,基于ArcGIS软件,利用已构建的多元回归方程,逐月计算出京津冀地区的综合干旱指数(CDI)。至此,完成整个模型的构建。
参照中国人民共和国国家标准《气象干旱等级》[9]中关于SPICI等级划分的标准,结合干旱等级发生的频率,按照特旱2%、重旱5%、中旱10%、轻旱15%和无旱68%要求,本文划分出5等级,如表2所示。
Table 2 Classification of drought grades

表2 干旱等级划分

干旱等级 特旱 重旱 中旱 轻旱 无旱
CDI <-2 [-2, -1) [-1, 0) [0, 1) ≥1

1.6 综合干旱监测模型验证

(1)基于SPI指数验证
McKee等[28]提出了SPI指数,该指数能较好地反映干旱强度和持续时间,对干旱变化响应敏感。不同时间尺度上的SPI值具有不同的物理意义。相对较短时间尺度上的SPI值可以略微反映短期土壤含水量的变化,这对农业生产至关重要。相对较长时间尺度的SPI值可以反映长期的水流变化,并在水库管理中发挥重要作用。3个月尺度的SPI对一年中干旱和洪水的发生和持续都很敏感,而且该指数能够反映短期气象干旱和洪水的特征,这与农业干旱密切相关。因此,本文选用SPI-3和CDI之间的相关性来进行模型的准确性验证。
(2)基于作物受旱面积验证
小麦对水分的需求量很高,干旱的发生会影响作物正常生长,作物受旱面积与干旱灾害之间存在密切相关关系,由于《统计年鉴》中并未统计地级市作物的受旱面积,因此本文利用2007—2016年京津冀省级行政单元的全年数据与干旱指数CDI进行相关分析,依此来验证模型,本文还将植被状态指数(VCI)、温度状态指数(TCI)与干旱指数CDI进行相关分析。
(3)基于作物单产验证
京津冀地区是我国冬小麦与夏玉米的主产区,小麦和玉米的产量可用于验证CDI指数。由于区域因素、气候特征和各亚区土壤肥力差异,对小麦单产数据进行了标准化处理,以消除抑制差异。计算公式如下:
P = P i - P ̅ σ (11)
式中:P为作物标准化单位产量;Pi为地级市第i年作物单产(t/hm2); P ̅ 为2007—2016年平均产量(t/hm2);σ为标准差。

2 结果分析

2.1 TRMM降尺度结果与检验

利用气象站点实测数据作为“真值”,选用相关系数R、拟合优度R2、偏差(Bias)、均方根误差(RMSE)等指标对TRMM降尺度年数据、月数据进行精度检验;选用平均绝对误差(MAE)来检验数据的可信度。基于GWR模型对京津冀地区多年平均TRMM 3B43降水量进行降尺度计算,空间分辨率由0.25°提高到1 km,精度得到提高,但降尺度后数据的有效性等还需要进行检验。本文利用研究区内的23个气象站2007—2016年的日值降水量数据进行验证,TRMM年降尺度后R2、Bias检验结果见图3
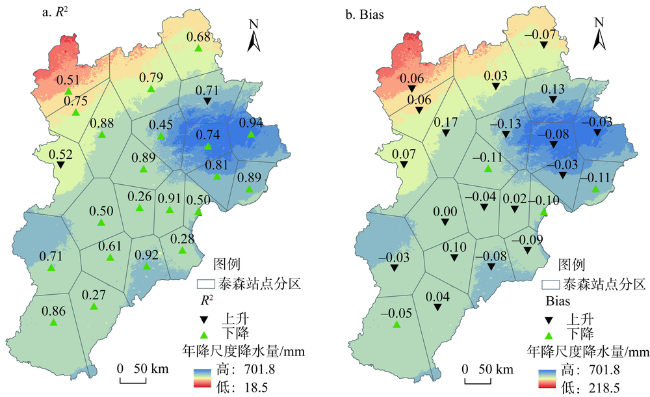
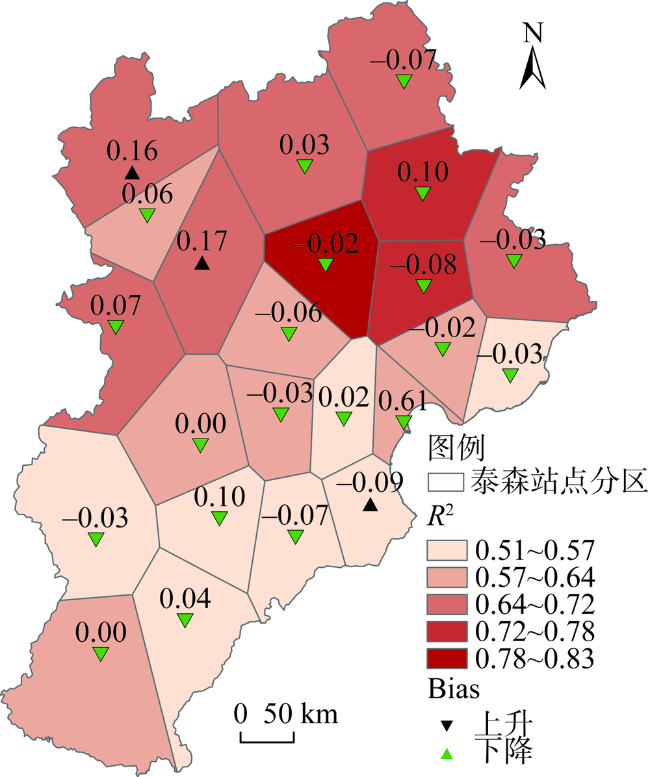
Fig. 3 R2 and Bias variations after downscaling of TRMM annual scale

图3 TRMM年降尺度后R2和Bias变化

图3可得,研究区23气象站点中,共有21个站点确定性系数R2的值变大。在R2增加的站点中,其原R2值一般较小,大部分在0.6以下。降尺度后,大部分站点的R2在0.7以上,其中大于0.8的站点有8个,大于0.7的站点有13个,低于0.5的仅有4个。从Bias指标来看,降尺度前Bias的绝对值在0~0.39范围,降尺度后为0~0.17,整体偏差在减小,23个站点中,有19个站点的绝对偏差比降尺度前有所减小,占站点总数的83%,仅有4个站点Bias增大且都分布在西北部干旱区,可能也是因为该区NDVI较低,降水与植被指数关系较小,而导致偏差值增大。但综合分析得到,通过GWR降尺度后,TRMM年降水量数据比降尺度前精度有所提高,表明通过此方法不仅能获得较高分辨率的TRMM降水数据,并在一定程度上提高了对降水量的估计。
利用23个气象站点数据对降尺度月降水量进行检验,通过与原始TRMM数据比较,月降尺度降水量的各项检验指标表现更优,R2为0.852,Bias<0.01(图4图5),说明基于占比系数方法得到的月降水数据与实测站点的月降水数据具有较好的一致性,能够合理地反映各月降水的时空分布。
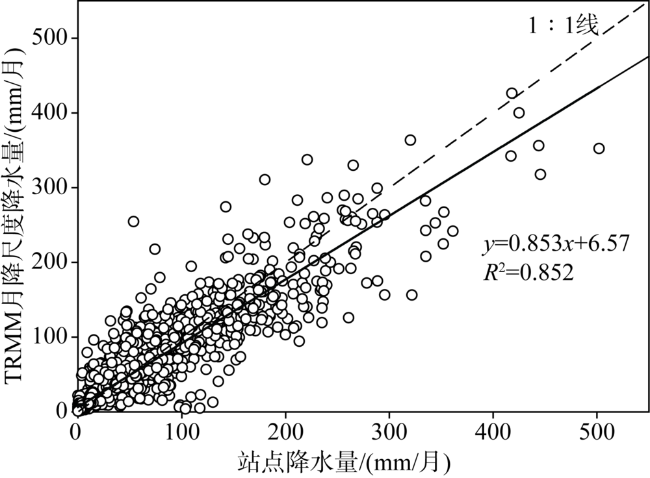
Fig. 4 Observed precipitation vs. downscaling TRMM precipitation (monthly scale)

图4 站点月降水量与TRMM月降尺度降水量数据散点图

Fig. 5 R2 and Bias variations after downscaling of TRMM monthly scale

图5 TRMM月降尺度后R2和Bias变化

图6a呈现的是2007—2016年23个气象站点所对应的月平均降水量数据。可以得到,降尺度后的月平均降水量数据与站点平均降水量数据走势一致,在站点降水量高值区,降尺度数据容易低估,在站点降水量低值区域,则容易出现高估现象,这可能与卫星传感器有关。为进一步检验,再将原始TRMM月平均降水量数据、降尺度月平均降水量数据分别与站点月平均降水量数据进行指标检验,得到R2(原始TRMM)=0.97、Bias(原始TRMM)=0.10、RMSE(原始TRMM)=71.42、MAE(原始TRMM)=47.57,R2(降尺度TRMM)=0.97、Bias(降尺度TRMM)<0.01、RMSE(降尺度TRMM)=65.32、MAE(降尺度TRMM)=43.19,从整体上来看,降尺度后的月平均降水量数据较原始TRMM数据更优。图6b和图6c是决定系数(R2)与偏差(Bias)的变化图,由图可以得到降尺度后的R2比原始TRMM的较高,Bias整体上也比原始TRMM更靠近0,说明降尺度月降水量数据与站点实测数据之间的更密切、数据精确也较高。通过以上分析可以得到,基于占比系数法对年降水量数据进行降尺度处理是可靠的,所得到的降尺度月降水量数据在保证数据准确性的前提下,大大提高了空间分辨,这也为后续干旱综合模型的构建提供了科学数据支撑。
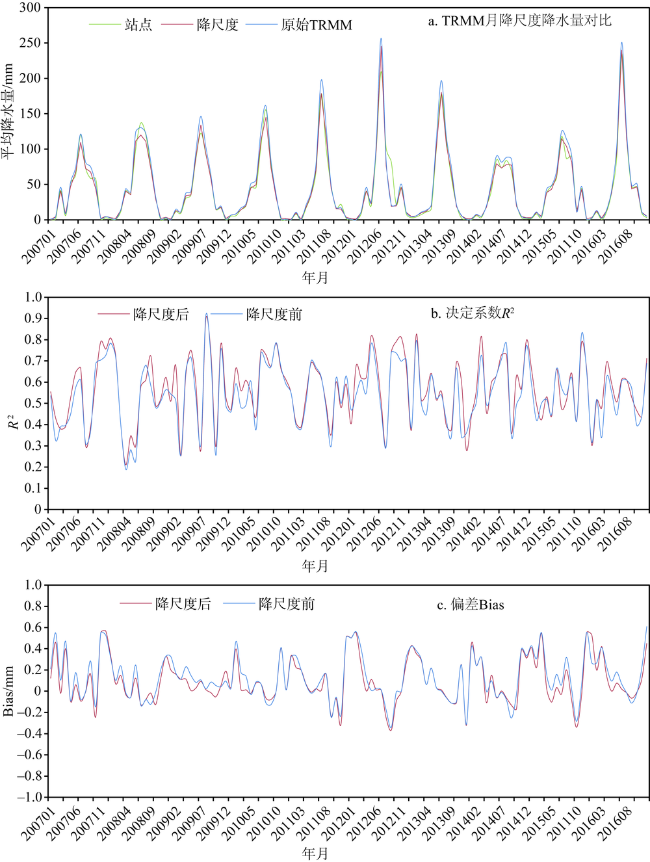
Fig. 6 Monthly precipitation in the Beijing-Tianjin-Hebei region during 2007-2016

图6 2007—2016年京津冀地区TRMM月降尺度降水量分析

2.2 综合干旱监测模型验证与结果分析

2.2.1 模型验证
(1)基于SPI指数验证
本文利用SPI指数来进一步交叉验证模型。为排除单个栅格点有可能存在异常噪音的可能,CDI干旱指数采用站点位置3×3栅格单元的平均值进行分析。将1-12各月CDI指数与SPI指数进行相关分析,结果见图7。结果显示,所有月份的相关系数都通过了P<0.01的显著性检验,除8月份的相关系数较低以外,其他月份的相关系数均大于0.5,说明该模型的可靠性得到了验证。
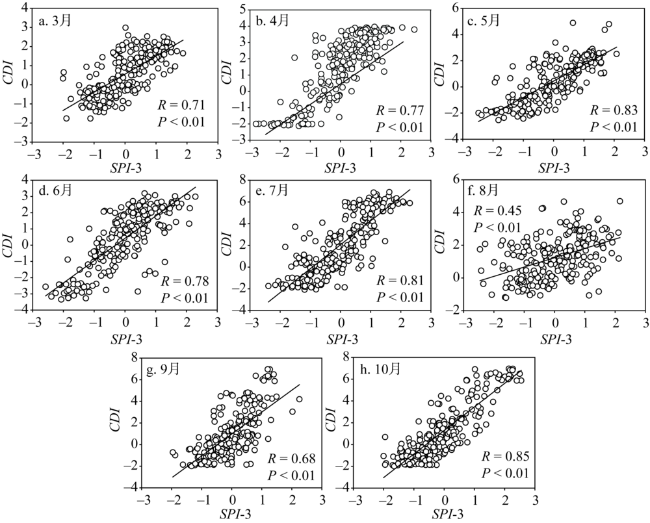
Fig. 7 Scatter plots and correlation coefficient of R values between SPI-3 and CDI index in each month from 2007 to 2016

图7 2007—2016年各月SPI-3与CDI相关系数R散点图

(2)基于作物受旱面积与作物单产验证
此外,将CDI指数与作物受旱面积进行相关分析(图8),CDI与受旱面积之间的R为-0.86,VCITCI与受旱面积的相关系数R值略小于CDI,但都通过了P<0.01的检验,表明利用CDI指数监测干旱在京津冀地区是适用的。
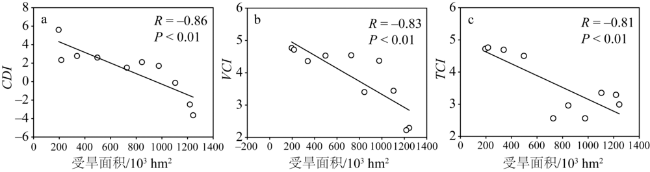
Fig. 8 Scatter plots and correlation coefficient of R values between drought-affected crop area and CDI, VCI, TCI from 2007 to 2016

图8 2007—2016年作物受旱面积与CDIVCITCI相关系数R散点图

与作物受旱面积相比,标准化作物单产与干旱有着密切的关系。因此本文选取保定、沧州、邯郸、石家庄、衡水、邢台等6个作物高产区作为典型验证区。结果表明,小麦生长期累积CDI指数与标准化作物单产有较好的相关性(图9)。R值介于0.60~0.76之间,具有显著性(P<0.05)。
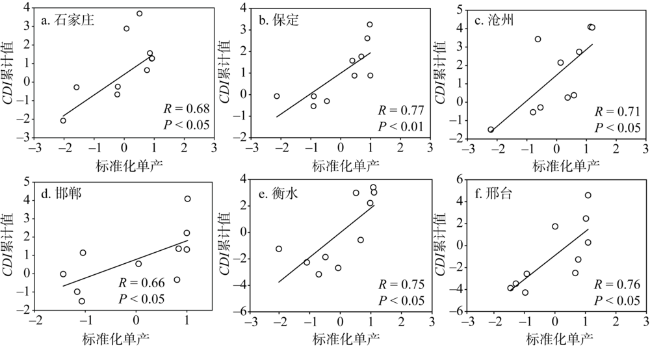
Fig. 9 Scatter plots and correlation coefficient of R values between accumulative CDI and standardized unit yield of crop in the growing period (March-October) from 2007 to 2016

图9 2007—2016年3-10月作物生长期累积CDI与作物标准化单产相关系数R散点图

2.2.2 综合干旱监测模型结果
利用CDI指数对京津冀地区2007—2016年的干旱情况进行了监测(图10)。结果表明,CDI指数能较好地反映京津冀地区旱情的发生和发展,与历史上的旱情观测结果基本一致。2016年京津冀地区发生了阶段性的干旱,春旱比较严重。本文以2016年3-7月为典型案列,对其干旱监测结果进行实例分析,并对该过程进行了可视化(图11)。结果表明,京津冀地区存在周期性干旱,春旱尤为严重。
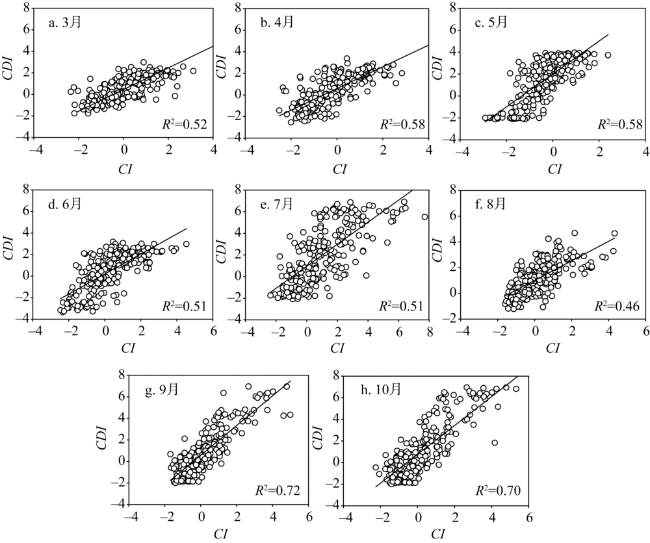
Fig. 10 Scatter plots and goodness-of-fit between CDI and CI in growing period of main crops (March-October) from 2007 to 2016

图10 2007—2016年主要作物生长期(3-10月)CICDI指数相关系数R散点图

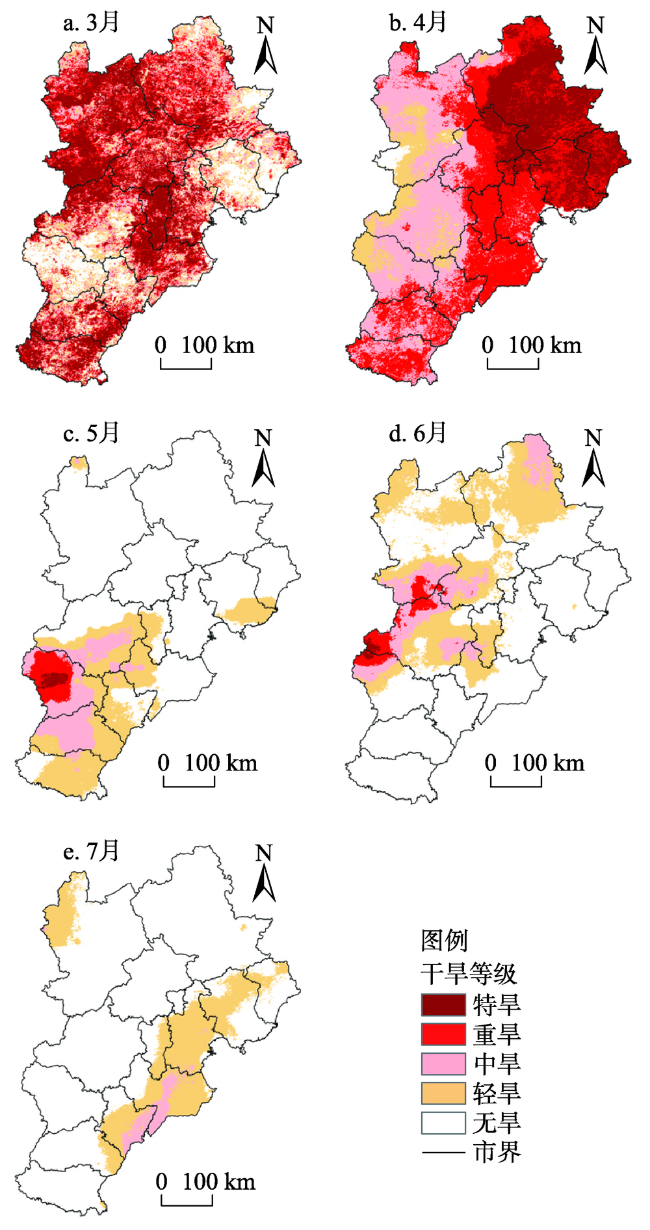
Fig. 11 Drought map of Beijing-Tianjin-Hebei region in 2016 based on monitored CDI index

图11 基于CDI指数监测的2016年京津冀地区干旱空间分布

图8可得,自3月中旬开始研究区气象干旱范围不断扩大。进入4月后,气象干旱逐步加剧,东部地区出现中等以上气象干旱(图8a)。5月初,出现一次大范围降水过程,降水量主要集中在北部,使北部地区旱情基本解除,但中南部地区旱情持续发展,保定和邢台两市为中度气象干旱,石家庄西部地区干旱达重度及以上。造成春旱的原因主要是2016年入春后,研究区降水偏少、气温偏高。春季,河北省平均气温高达14.5 ℃,较常年偏高1.5 ℃,属于显著偏高年,为建站以来的第二高值年,其中气温偏高1 ℃以上的地区占比达90%,有超过60%的县(市)偏高1.5 ℃以上,其中唐山中部、石家庄东北部、邯郸北部等区域偏高超过2 ℃。从降水量来看,春季京津冀地区平均降水量不足50 mm,属于偏少年份,在空间分布上,长城以北降水接近常年或偏多,长城以南大部分地区偏少超过40%。
研究区夏初降水偏少,6月初,河北省中西部以及张家口、承德西部、唐山等地出现气象干旱,张家口与保定交界处出现重旱,保定西南部与石家庄西北部出现重旱、特旱。6月13-15日出现大范围降水过程,全省旱情基本解除,仅局部存在轻度气象干旱。7月初,干旱又再次发展,这次主要集中在中东部部分地区,但7月18-21日,研究区突降暴雨,降水过程来势猛,雨量大、范围广,过程平均降水量达到154 mm,伴随降水干旱解除。通过干旱综合监测模型得到的结果与2016年《河北省气候公报》的分析基本一致,说明本文得出的结果得到了实例验证。
除了2016年发生的严重干旱外,CDI指数也较好地监测到2007—2016年主要作物(冬小麦、玉米)生长期(3-10月)干旱过程,具体CDI指数变化情况如图12所示。
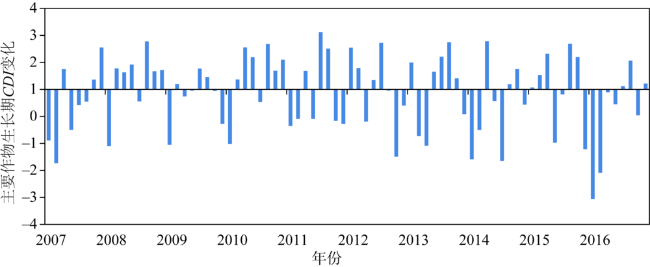
Fig. 12 Histogram plot of CDI of the Jing-Jin-Ji region in crop (winter wheat and maize) growing period (March-October) from 2007 to 2016

图12 京津冀地区2007—2016年主要作物(冬小麦、玉米)生长期(3-10月)CDI变化

为了定量分析京津冀地区干旱变化的趋势,本文利用一元线性回归模型拟合2007—2016年CDI干旱指数随时间变化的关系,然后按照春、夏、秋、冬四期统计出每一期的方程的回归系数(K值)等统计信息,见表3。春季K值<0的区域面积约为19.93万km2,约占研究区面积的93.12%;夏季K值>0的区域面积约为17.65万km2,约占研究区面积的86.25%;秋季K值正负值区域基本相等;冬季干旱有逐年加剧的趋势,计算结果见表3
Table 3 Statistics of CDI index changes in the four seasons of 2007-2016

表3 2007—2016年CDI指数四季变化统计量

季节 K CDI趋势 干旱趋势 面积/103 km2 比例/%
<0 199.27 93.12
0 - - 4.58 2.14
>0 10.14 4.74
<0 33.06 15.45
0 - - 4.39 2.05
>0 176.54 82.5
<0 102.16 47.74
0 - - 4.52 2.11
>0 107.31 50.15
<0 175.81 82.16
0 - - 4.54 2.12
>0 33.64 15.72

注:符号“↑”表示指标在上升,“↓”表示指标在下降,“-”表示保持不变。

3 结论与讨论

3.1 结论

(1)本文首先基于GWR模型对TRMM 3B43数据进行降尺度,充分发挥了GWR模型在表达地理空间异质性上的优势,再借助占比系数法得到了空间分辨率为1 km的月尺度TRMM数据,并通过了各项检验。结果表明,通过本文采用的降尺度方法能够在保证数据准确性、可靠性的前提下,得到较高分辨率的降水数据,提高了数据的空间分辨率,较好地反映了研究区内的降水空间分布。
(2)利用TRMM降尺度数据、MODIS数据构建了半经验半机理的综合干旱监测模型,计算了京津冀地区2007—2016年的遥感综合干旱指数(CDI)时序数据,并分别通过受旱实例、SPI指数、作物受旱面积与作物标准化单产等进行交叉验证,结果表明所构建的CDI干旱指数通过各项检验,能够较好地监测出干旱过程。

3.2 讨论

陆地干旱、水分变化等趋势研究一直是全球研究的热点。在全球一级干旱评估研究中,Greve等[32]发现全球约四分之三的土地面积,无法检测到强烈的干旱变化。10.8%的全球土地面积显示出强烈的“干变干,湿变湿”模式,相比之下,9.5%的全球土地面积显示出相反的模式,即“干变湿,湿变干”。Feng等[33]利用卫星土壤水分研究了过去35年(1979—2013年)的全球水分变化趋势,其结果支持了Greve等[32]的研究结果。
在本文中,春季、冬季干旱趋势严重,夏季干旱趋于减弱,结果可能与Greve等[32]的结果不同。这可能是由于以下原因造成的:第一,本文时间序列仅为10年,时间尺度短,只能反映过去10年的变化。第二,Ding等[34,35]认为本世纪东亚夏季风将得到加强,未来该地区季风降雨带将向北推移,将改变目前南方洪涝、北方干旱的气候格局,从而减弱了京津冀地区夏季干旱。因此,较长时间序列和多变量数据集是准确分析京津冀地区干旱趋势必不可少的研究基础,这也是下一步的研究重点和方向。
[1]
WMO. Report on Drought and Countries Affected by Drought During 1974-1985. WMO, Geneva, 1986.

[2]
中华人民共和国气象行业标准. QX/T81-2007小麦干旱灾害等级. 北京: 中国气象局, 2007.

[Meteorological Industry Standard of the People's Republic of China. QX/T81-2007 wheat drought disaster grade. Beijing: China Meteorological Administration, 2007.]

[3]
MISHRA A, SINGH V P.A review of drought concepts. Journal of Hydrology, 2010, 391(1): 202-216.

DOI

[4]
DAI A.Drought under global warming: A review. Wiley Interdisciplinary Reviews: Climate Change, 2011, 2(1): 45-65.

DOI

[5]
ZHANG Y, PENG C H, LI W Z, et al.Monitoring and estimating drought-induced impacts on forest structure, growth, function, and ecosystem services using remote-sensing data: Recent progress and future challenges. Environmental Reviews, 2013, 2(2): 103-115.

[6]
LIU X F, ZHU X F, PAN Y Z, et al.Agricultural drought monitoring: Progress, challenges, and prospects. Journal of Geographical Sciences, 2016, 26(6): 750-767.In this paper, we compared the concept of agricultural drought and its relationship with other types of droughts and reviewed the progress of research on agricultural drought monitoring indices on the basis of station data and remote sensing. Applicability and limitations of different drought monitoring indices were also compared. Meanwhile, development history and the latest progress in agricultural drought monitoring were evaluated through statistics and document comparison, suggesting a transformation in agricultural drought monitoring from traditional single meteorological monitoring indices to meteorology and remote sensing-integrated monitoring indices. Finally, an analysis of current challenges in agricultural drought monitoring revealed future research prospects for agricultural drought monitoring, such as investigating the mechanism underlying agricultural drought, identifying factors that influence agricultural drought, developing multi-spatiotemporal scales models for agricultural drought monitoring, coupling qualitative and quantitative agricultural drought evaluation models, and improving the application levels of remote sensing data in agricultural drought monitoring.

DOI

[7]
DU L T, TIAN Q J, YU T, et al.A comprehensive drought monitoring method integrating MODIS and TRMM data. International Journal of Applied Earth Observation and Geoinformation, 2013, 23(1): 245-253.

DOI

[8]
邹旭恺, 张强, 王有民, 等. 干旱指标研究进展及中美两国国家级干旱监测. 气象, 2005, (7): 6-9.

[ZOU X K, ZHANG Q, WANG Y M, et al.Progress in drought indicators and national drought monitoring in China and the United States. Meteorology, 2005, (7): 6-9.]

[9]
张强, 邹旭凯, 肖风劲. 中华人民共和国国家标准气象干旱等级. GB/T20481-2006. 北京: 中国标准出版社, 2006.

[ZHANG Q, ZOU X K, XIAO F J. Meteorological Drought Grade.GB/T 20481-2006, National Standard of the People's Republic of China. Beijing: China Standards Press, 2006.]

[10]
HABOUDANE D, MILLER J R, PATTEY E, et al.Hyperspectral vegetation indices and novel algorithms for predicting green LAI of crop canopies. Remote Sensing of Environment, 2004, 90(3): 337-352.Abstract

A growing number of studies have focused on evaluating spectral indices in terms of their sensitivity to vegetation biophysical parameters, as well as to external factors affecting canopy reflectance. In this context, leaf and canopy radiative transfer models are valuable for modeling and understanding the behavior of such indices. In the present work, PROSPECT and SAILH models have been used to simulate a wide range of crop canopy reflectances in an attempt to study the sensitivity of a set of vegetation indices to green leaf area index (LAI), and to modify some of them in order to enhance their responsivity to LAI variations. The aim of the paper was to present a method for minimizing the effect of leaf chlorophyll content on the prediction of green LAI, and to develop new algorithms that adequately predict the LAI of crop canopies. Analyses based on both simulated and real hyperspectral data were carried out to compare performances of existing vegetation indices (Normalized Difference Vegetation Index [NDVI], Renormalized Difference Vegetation Index [RDVI], Modified Simple Ratio [MSR], Soil-Adjusted Vegetation Index [SAVI], Soil and Atmospherically Resistant Vegetation Index [SARVI], MSAVI, Triangular Vegetation Index [TVI], and Modified Chlorophyll Absorption Ratio Index [MCARI]) and to design new ones (MTVI1, MCARI1, MTVI2, and MCARI2) that are both less sensitive to chlorophyll content variations and linearly related to green LAI. Thorough analyses showed that the above existing vegetation indices were either sensitive to chlorophyll concentration changes or affected by saturation at high LAI levels. Conversely, two of the spectral indices developed as a part of this study, a modified triangular vegetation index (MTVI2) and a modified chlorophyll absorption ratio index (MCARI2), proved to be the best predictors of green LAI. Related predictive algorithms were tested on CASI (Compact Airborne Spectrographic Imager) hyperspectral images and, then, validated using ground truth measurements. The latter were collected simultaneously with image acquisition for different crop types (soybean, corn, and wheat), at different growth stages, and under various fertilization treatments. Prediction power analysis of proposed algorithms based on MCARI2 and MTVI2 resulted in agreements between modeled and ground measurement of non-destructive LAI, with coefficients of determination (r2) being 0.98 for soybean, 0.89 for corn, and 0.74 for wheat. The corresponding RMSE for LAI were estimated at 0.28, 0.46, and 0.85, respectively.

]]>

DOI

[11]
SANDHOLT I, RASMUSSEN K, ANDERSEN J.A simple interpretation of the surface temperature-vegetation index space for assessment of surface moisture status. Remote Sensing of Environment, 2002, 79(2-3): 213-224.

DOI

[12]
王鹏新, 龚健雅, 李小文. 基于植被指数和土地表面温度的干旱监测模型. 地球科学进展, 2003, 18(4): 527-533.

[WANG P X, GONG J Y, LI X W.Drought monitoring model based on vegetation index and land surface temperature. Progress in Geosciences, 2003, 18(4): 527-533.]

[13]
THEON J S.The tropical rainfall measuring mission (TRMM). Advances in Space Research, 1994, 14(3): 159-165.

[14]
贾艳青, 张勃. 1960—2016年中国北方地区极端干湿事件演变特征. 自然资源学报, 2019, 34(7): 1543-1554.

[JIA Y Q, ZHANG B.Evolution characteristics of extreme dry and wet events in northern China from 1960 to 2016. Journal of Natural Resources, 2019, 34(7): 1543-1554.]

[15]
范琳琳, 王红瑞, 罗文兵, 等. 京津冀地区旱涝空间特征及其对农业用水的影响. 中国农村水利水电, 2016, (8): 150-155.

[FAN L L, WANG H R, LUO W B, et al.Spatial characteristics of drought and flood in Beijing-Tianjin-Hebei region and their impact on agricultural water use. Rural Water Resources and Hydropower in China, 2016, (8): 150-155.]

[16]
安淳淳, 王飞, 焦俏, 等. 华北平原典型干旱年土壤水分及灌溉特征遥感分析. 中国水土保持科学, 2016, 14(5): 123-129.

[AN C C, WANG F, JIAO Q, et al.Remote sensing analysis of soil moisture and irrigation characteristics in typical arid years in North China Plain. Soil and Water Conservation Science of China, 2016, 14(5): 123-129.]

[17]
方宏阳, 杨志勇, 栾清华, 等. 基于SPI的京津冀地区旱涝时空变化特征分析. 水利水电技术, 2013, 44(10): 13-16.

[FANG H Y, YANG Z Y, LUAN Q H, et al.Spatial and temporal variation characteristics of drought and flood in Beijing, Tianjin and Hebei region based on SPI. Water Resources and Hydropower Technology, 2013, 44(10): 13-16.]

[18]
李双双, 杨赛霓, 刘焱序, 等. 1960—2013年京津冀地区干旱—暴雨—热浪灾害时空聚类特征. 地理科学, 2016, 36(1): 149-156.

[LI S S, YANG S N, LIU Y X, et al.Spatial and temporal clustering characteristics of drought-rainstorm-heat wave disasters in Beijing-Tianjin-Hebei region from 1960 to 2013. Scientia Geographica Sinica, 2016, 36(1): 149-156.]

[19]
李双双, 杨赛霓, 刘宪锋. 面向非过程的多灾种时空网络建模: 以京津冀地区干旱热浪耦合为例. 地理研究, 2017, 36(8): 1415-1427.

[LI S S, YANG S N, LIU X F.Modeling of non-process-oriented multi-hazard space-time Network: Taking the coupling of drought and heat waves in Beijing-Tianjin-Hebei region as an example. Geographical Research, 2017, 36(8): 1415-1427.]

[20]
KIOUTSIOUKIS I, MELAS D, ZANIS P.Statistical downscaling of daily precipitation over Greece. International Journal of Climatology, 2008, 28(5): 679-691.

DOI

[21]
CHEN F R, LIU Y, LIU Q, et al.Spatial downscaling of TRMM 3B43 precipitation considering spatial heterogeneity. International Journal of Remote Sensing, 2014, 35(9): 3074-3093.The availability of accurate precipitation data with high spatial resolution is deemed necessary for many types of hydrological, meteorological, and environmental applications. The Tropical Rainfall Measuring Mission (TRMM) data sets can provide effective precipitation information, but at coarse resolution (0.25 degrees), so it is very important to improve their resolution. There is a strong relationship between precipitation and other environment variables (e.g. vegetation and topography). The existing precipitation-downscaling methods attempt to describe this relationship by using a uniform empirical model. However, in the real world, the relationship is disturbed due to the influence of certain factors such as soil type, hydrological conditions, and human activities. In this study, a new downscaling method considering this spatial heterogeneity was proposed to downscale version 7 of the TRMM 3B43 precipitation product, which assumes that the relationship varies spatially but is the same in a local region. At a spatial resolution of 0.25 degrees, the spatially varying relationship among TRMM, normalized difference vegetation index (NDVI), and digital elevation model (DEM) is explored by using a local regression analysis approach known as geographically weighted regression (GWR), but this relationship is the same in a pixel of 0.25 degrees x0.25 degrees. The derived relationship is used to construct the precipitation downscaling model, which then produces 1 km downscaled precipitation data. The existing and proposed downscaling methods were both tested in North China for 2008-2011. The accuracy of the downscaled precipitation was validated by comparing it with observed precipitation data from 49 meteorological stations located in the study area. The results show that GWR is more suitable to capture the relationship among TRMM, DEM, and NDVI (minimum R-2=0.93). Compared with the existing downscaling method, the proposed method, which consistently showed increased R-2 (e.g. from 0.80 to 0.82 in 2011) and reduced RMSE (e.g. from 125.4mm to 91mm in 2011) in all four years, can more accurately produce downscaled precipitation data.

DOI

[22]
LV A F, ZHOU L.A rainfall model based on a geographically weighted regression algorithm for rainfall estimations over the Arid Qaidam Basin in China. Remote Sensing, 2016, 8(4): 1-17.

DOI

[23]
IMMERZEEL W W, RUTTEN M M, DROOGERS P.Spatial downscaling of TRMM precipitation using vegetative response on the Iberian Peninsula. Remote Sensing of Environment, 2009, 113(2): 362-370.

DOI

[24]
JIA S F, ZHU W B, LV A F, et al.A statistical spatial downscaling algorithm of TRMM precipitation based on NDVI and DEM in the Qaidam Basin of China. Remote Sensing of Environment, 2011, 115(12): 3069-3079.The availability of precipitation data with high spatial resolution is of fundamental importance in several applications such as hydrology, meteorology and ecology. At present, there are mainly two sources of precipitation estimates: raingauge stations and remote sensing technology. However, a large number of studies demonstrated that traditional point measurements based on raingauge stations cannot reflect the spatial variation of precipitation effectively, especially in ungauged basins. The technology of remote sensing has greatly improved the quality of precipitation observations and produced reasonably high resolution gridded precipitation fields. These products, derived from satellites, have been widely used in various parts of the world. However, when applied to local basins and regions, the spatial resolution of these products is too coarse. In this paper, we present a statistical downscaling algorithm based on the relationships between precipitation and other environmental factors in the Qaidam Basin such as topography and vegetation, which was developed for downscaling the spatial precipitation fields of these remote sensing products. This algorithm is demonstrated with the Tropical Rainfall Measuring Mission (TRMM) 3B43 dataset, the Digital Elevation Model (DEM) from the Shuttle Radar Topography Mission (SRTM) and SPOT VEGETATION. The statistical relationship among precipitation, DEM and Normalized Difference Vegetation Index (NDVI), which is a proxy for vegetation, is variable at different scales: therefore, a multiple linear regression model was established under four different scales (0.25 degrees, 0.50 degrees, 0.75 degrees and 1.00 degrees, respectively). By applying a downscaling methodology, TRMM 3B43 0.25 degrees x 0.25 degrees precipitation fields were downscaled to 1 x 1 km pixel precipitation for each year from 1999 to 2009. On the basis of three criteria, these four downscaled results were compared with each other and the regression model established at the resolution of 0.50 degrees was selected as the final downscaling algorithm in this study. The final downscaled results were validated by applying the observations for a duration of 11 years obtained from six raingauge stations in the Qaidam Basin. These results indicated that the downscaled result effectively captured the trends in inter-annual variability and the magnitude of annual precipitation with the coefficient of determination r(2) ranging from 0.72 to 0.96 at six different raingauge stations. (C) 2011 Elsevier Inc.

DOI

[25]
CHEN C, ZHAO, S H, DUAN Z, et al.An improved spatial downscaling procedure for TRMM 3B43 precipitation product using geographically weighted regression. IEEE Journal of Selected Topics in Applied Earth Observations and Remote Sensing, 2015, 8(9): 4592-4604.

DOI

[26]
FOTHERINGHAM A S, BRUNSDON C, CHARLTON M. Geographically Weighted Regression. New York: Wiley, 2002.

[27]
DUAN Z, BASTIAANSSEN W G M. First results from Version 7 TRMM 3B43 precipitation product in combination with a new downscaling-calibration procedure. Remote Sensing of Environment, 2013, 131: 1-13.

DOI

[28]
MCKEE T B, DOESKEN N J, KLEIST J.The relationship of drought frequency and duration to time scales. Proceedings of the 8th Conference on Applied Climatology: American Meteorological Society Boston, MA, 1993: 179-183.

[29]
PEREIA A R, PRUITT W O.Adaptation of the Thornthwaite scheme for estimating daily reference evapotranspiration. Agricultural Water Management, 2004, 66(3): 251-257.

DOI

[30]
TRAJKORIC S.Temperature-based approaches for estimating reference evapotranspiration. Journal of Irrigation and Drainage Engineering, 2005, 131(4): 316-325.

DOI

[31]
KOGAN F N.Global drought watch from space. Bulletin of the American Meteorological Society, 1997, 78(4): 621-636.

DOI

[32]
GREVE P, ORLOWSKY B, MUELLER B, et al.Global assessment of trends in wetting and drying over land. Nature Geoscience, 2014, 7(10): 716-721.Changes in the hydrological conditions of the land surface have substantial impacts on society(1,2). Yet assessments of observed continental dryness trends yield contradicting results(3-7). The concept that dry regions dry out further, whereas wet regions become wetter as the climate warms has been proposed as a simplified summary of expected8-10 as well as observed(10-14) changes over land, although this concept is mostly based on oceanic data(8,10). Here we present an analysis of more than 300 combinations of various hydrological data sets of historical land dryness changes covering the period from 1948 to 2005. Each combination of data sets is benchmarked against an empirical relationship between evaporation, precipitation and aridity. Those combinations that perform well are used for trend analysis. We find that over about three-quarters of the global land area, robust dryness changes cannot be detected. Only 10.8% of the global land area shows a robust 'dry gets drier, wet gets wetter' pattern, compared to 9.5% of global land area with the opposite pattern, that is, dry gets wetter, and wet gets drier. We conclude that aridity changes over land, where the potential for direct socio-economic consequences is highest, have not followed a simple intensification of existing patterns.

DOI

[33]
FENG H H, ZHANG M Y.Global land moisture trends: Drier in dry and wetter in wet over land. Scientific Reports, 2015, 7(12): 18018.

DOI

[34]
DING Y H, WANG Z Y, SUN Y.Inter-decadal variation of the summer precipitation in East China and its association with decreasing Asian summer monsoon. Part I: Observed evidences. International Journal of Climatology, 2008, 28(9): 1139-1161.

DOI

[35]
DING Y H, SUN Y, WANG Z Y.Inter-decadal variation of the summer precipitation in China and its association with decreasing Asian summer monsoon (Part II): Possible causes. International Journal of Climatology, 2009, 29(13): 1926-1944.

DOI

文章导航

/