
2000—2015年青藏高原植被NPP时空变化格局及其对气候变化的响应
陈舒婷(1996- ),女,山东淄博人,硕士,主要从事灾害与生态环境遥感方面的研究。E-mai: 2578749407@qq.com
收稿日期: 2019-04-30
要求修回日期: 2019-08-23
网络出版日期: 2020-12-28
基金资助
山东省自然科学基金项目(ZR2018BD001)
国家重点研发计划项目(2017YFA0604804)
山东省高等学校科学技术计划项目(J18KA181)
山东省基础地理信息与数字化技术重点实验室开放基金项目
Spatial and temporal patterns of NPP and its response to climate change in the Qinghai-Tibet Plateau from 2000 to 2015
Received date: 2019-04-30
Request revised date: 2019-08-23
Online published: 2020-12-28
Copyright
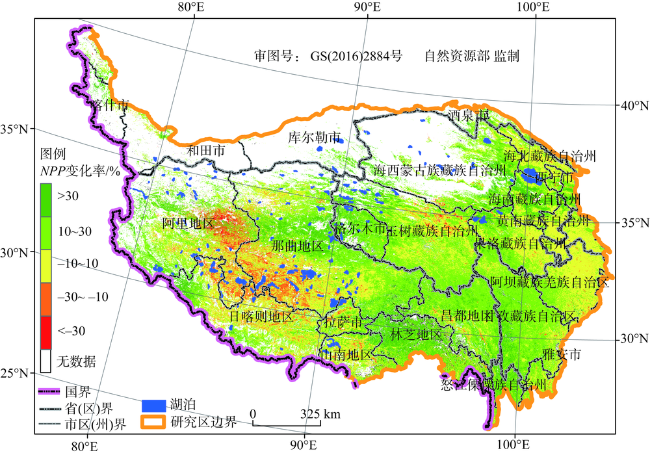
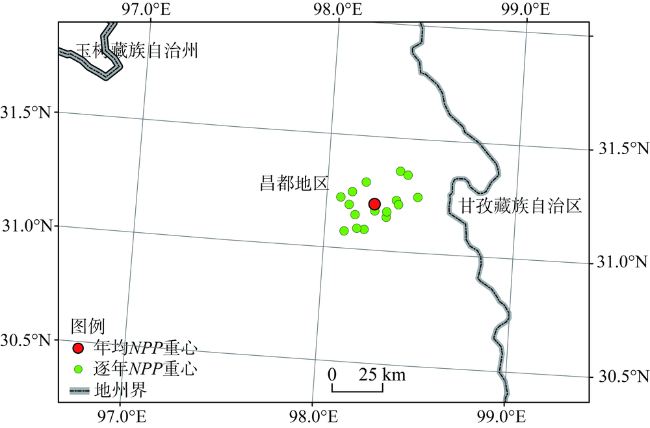
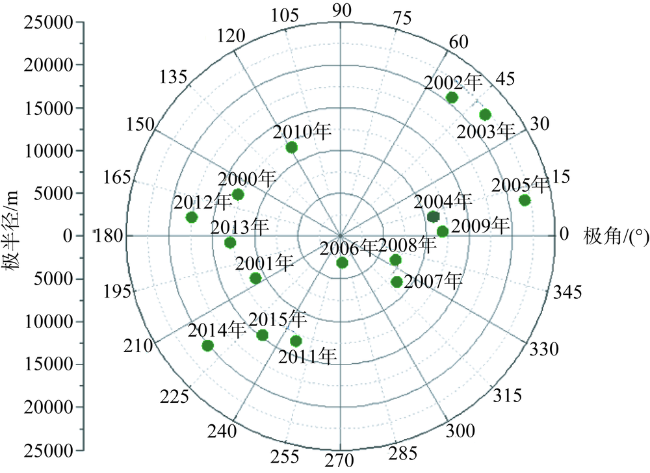
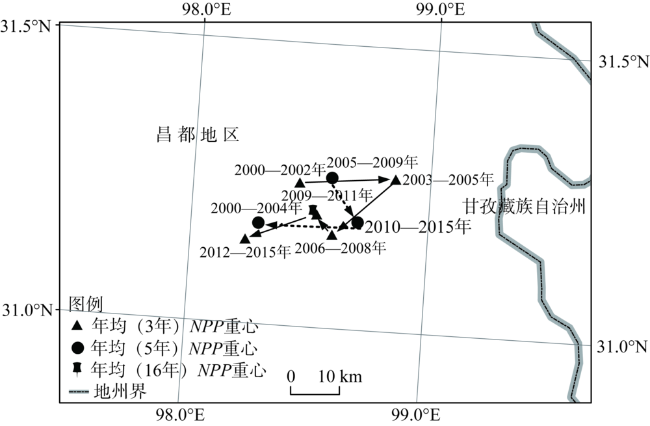
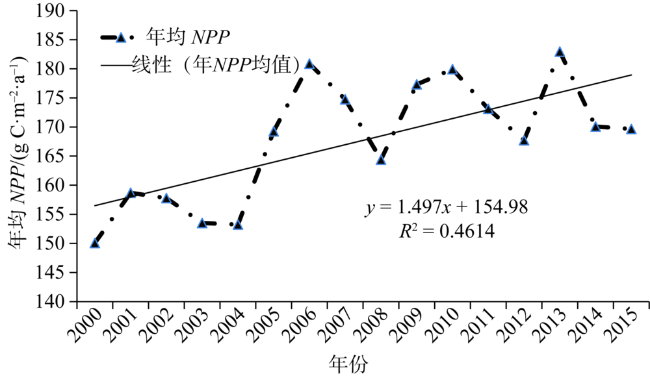
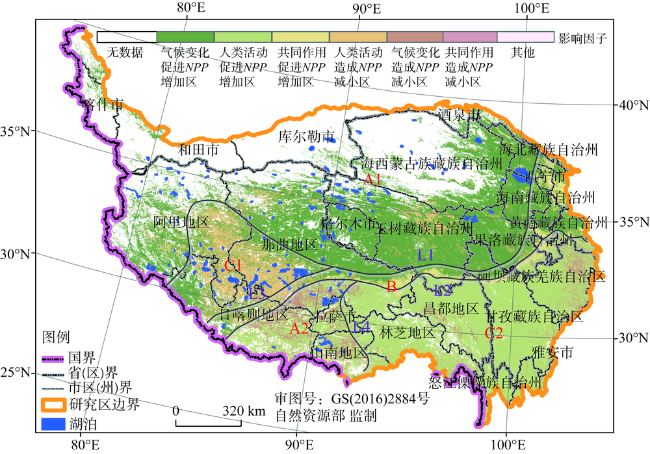
全球变化背景下,青藏高原作为我国乃至全球气候变化的“天然实验室”,植被生态系统发生了深刻变化。引入重心模型等方法分析和探讨2000—2015年青藏高原植被NPP时空变化格局及其驱动机理,并定量区分NPP变化过程中气候变化和人类活动的相对作用。研究发现:(1)2000—2015年,青藏高原植被NPP年均值总体上呈现从东南向西北递减的趋势。在年际变化方面,近16年植被NPP呈现波动上升趋势,其中在2005年出现上升陡坡,并在2005—2015年表现为高位波动的态势。(2)青藏高原植被NPP增加区(变化率>10%)主要集中于三江源地区、横断山区北部、雅鲁藏布江中下游以及那曲地区的中东部,而植被NPP减小区(变化率<-10%)则主要分布于雅鲁藏布江上游和阿里高原。(3)近16年青藏高原植被NPP重心总体向西南方向移动,表明西南部植被NPP在增量和增速上大于东北部。(4)青藏高原植被NPP与气候因子相关性的地区差异显著,其中植被NPP与降水显著相关的区域主要位于青藏高原中部、青藏高原东南部及雅鲁藏布江流域中下游,而植被NPP与气温显著相关的区域主要位于藏南地区、横断山区北部、青藏高原中部和北部。(5)气候变化和人类活动在青藏高原植被NPP变化过程中的相对作用存在显著的时空差异性,在空间上呈现“四线—五区”的格局。研究成果能够为揭示青藏高原区域生态系统对全球变化的响应机制提供理论和方法支撑。
陈舒婷 , 郭兵 , 杨飞 , 韩保民 , 范业稳 , 杨潇 , 何田莉 , 刘悦 , 杨雯娜 . 2000—2015年青藏高原植被NPP时空变化格局及其对气候变化的响应[J]. 自然资源学报, 2020 , 35(10) : 2511 -2527 . DOI: 10.31497/zrzyxb.20201016
The Qinghai-Tibet (QT) Plateau is considered as the "natural laboratory" of climate change in China and even in the world. Under the background of global change, the vegetation ecosystem of the QT has undergone profound changes. In this study, the spatian and temporal patterns and its driving mechanisms of NPP in the QT Plateau from 2000 to 2015 were analyzed and discussed by using gravity center and correlation coefficient models. Then, the relative effects of climate change and human activity on the process of NPP changes was quantitatively distinguished. The results show that: (1) From 2000 to 2015, the annual mean NPP in the QT Plateau showed a decreasing trend from southeast to northwest. In terms of interannual changes, the annual mean NPP showed a fluctuating upward trend in the study period, with a sharp rise in 2005 and a high fluctuation during 2005-2015. (2) The increased area of NPP in the QT Plateau (change rate >10%) was mainly concentrated in the Three-River Source Region, the northern Hengduan Mountains, the middle and lower reaches of the Yarlung Zangbo River Basin and the central and eastern parts of Naqu county, while the decreased area of NPP (change rate <-10%) was mainly distributed in the upper reaches of the Yarlung Zangbo River Basin and the Ali Plateau. (3) During the 16 years, the gravity center of NPP in the QT Plateau moved eastward, indicating that the increment and growth rate of NPP in the eastern part is greater than that in the western part. (4) The correlation between vegetation NPP and climate factors in the study area is significant. The regions with significant correlation between NPP and precipitation are mainly located in the central and the southeastern parts of the QT Plateau and the middle and lower reaches of the Yarlung Zangbo River Basin. The regions with significant correlation between vegetation NPP and temperature are mainly located in Southern Tibet, Northern Hengduan Mountains, Central and Northern QT Plateau. (5) The relative effects of climate change and human activity on the process of NPP change in the plateau have significant spatial and temporal differences with a distribution pattern of "Four Lines and Five Regions". The research results can provide theoretical and methodological supports for revealing the response mechanism of regional ecosystems to global change in the QT Plateau.
Key words: NPP; gravity center model; driving mechanism; global change; Qinghai-Tibet Plateau
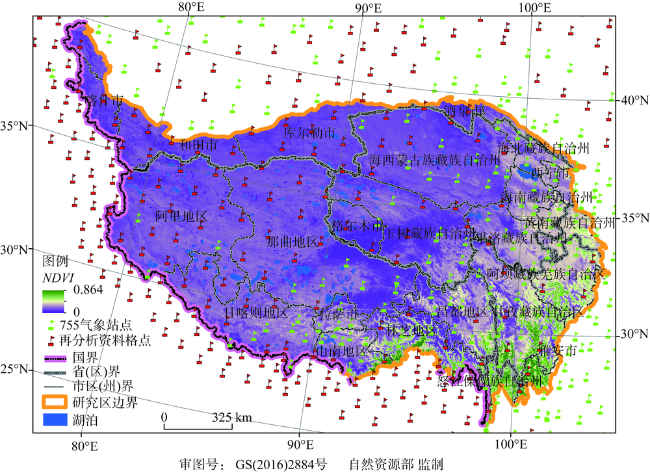
Fig. 1 Location of the study region图1 研究区概况 |
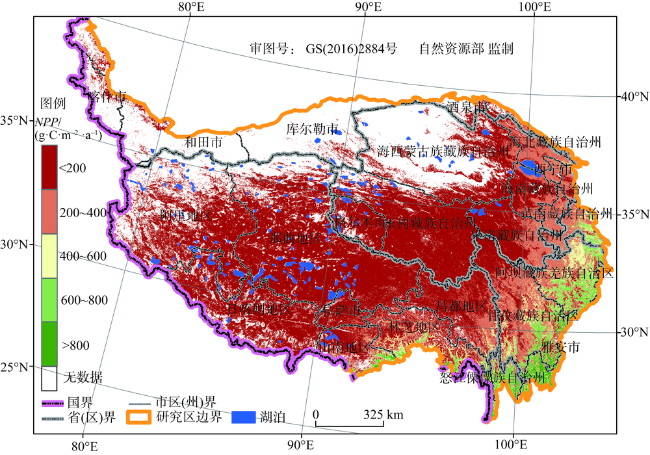
Fig. 2 Distribution characteristics of average vegetation NPP in the past 16 years图2 近16年平均植被NPP分布特征 |
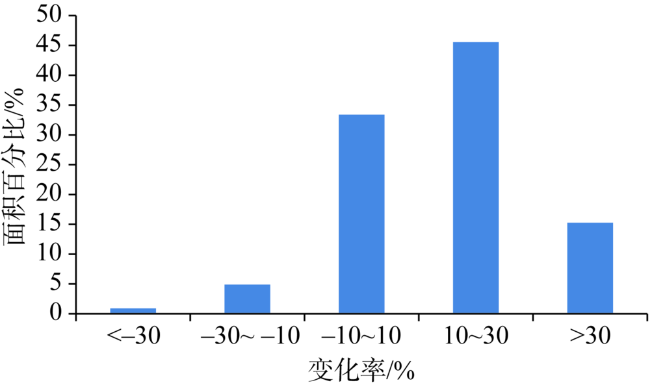
Fig. 3 Area percentage comparisons of different grades in NPP variation rates in the Qinghai-Tibet Plateau from 2000 to 2015图3 2000—2015年青藏高原植被NPP不同等级变化率面积百分比对比 |
Fig. 4 Spatial distributions of different grades of NPP variation rate in the Qinghai-Tibet Plateau from 2000 to 2015图4 2000—2015年青藏高原植被NPP不同等级变化率空间分布 |
Fig. 5 Distributions of gravity center of NPP in the Qinghai-Tibet Plateau from 2000 to 2015图5 2000—2015年青藏高原植被NPP重心分布 |
Fig. 6 Distribution ratio of NPP gravity center in the Qinghai-Tibet Plateau from 2000 to 2015 (Polar coordinates)图6 2000—2015年青藏高原植被NPP重心分布比例(极坐标系) |
Fig. 7 Migration trajectory of NPP gravity center in the Qinghai-Tibet Plateau at different time scales图7 不同时间尺度下青藏高原植被NPP重心迁移轨迹 |
Fig. 8 Interannual variation of NPP in the Qinghai-Tibet Plateau from 2000 to 2015图8 2000—2015年青藏高原植被NPP均值年际变化 |
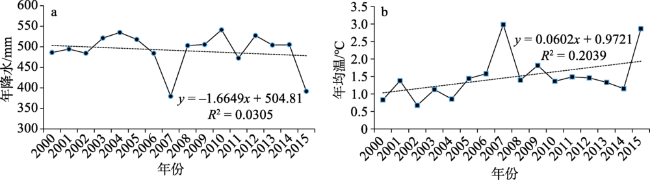
Fig. 9 Interannual variation characteristics of climate factors in the Qinghai-Tibet Plateau图9 青藏高原气候因子年际变化特征 |
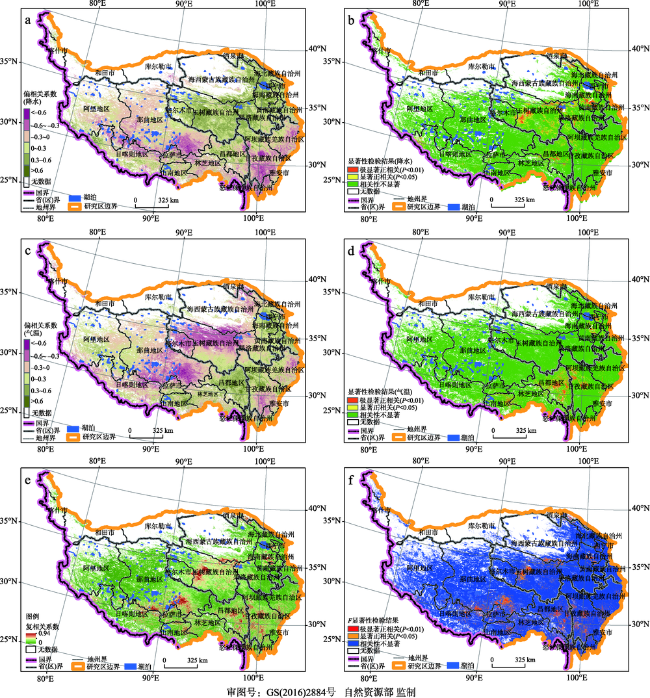
Fig. 10 Partial correlation coefficient, multiple correlation coefficient and significance test results of NPP with temperature and precipitation in the Qinghai-Tibet Plateau图10 植被NPP与气温、降水的偏相关系数、复相关系数及其显著性检验结果 |
Table 1 Relative effects of climate change and human activity on vegetation degradation and recovery表1 气候变化和人类活动对植被退化或恢复的相对作用 |
| NPP变化状况 | 情景 | Kc | Kh | 气候相对作用 | 人类活动相对作用 |
|---|---|---|---|---|---|
| NPP增加 (植被恢复) | 情景1 | >0 | >0 | 100 | 0 |
| 情景2 | <0 | <0 | 0 | 100 | |
| 情景3 | >0 | <0 | 共同作用 | 共同作用 | |
| NPP减小 (植被退化) | 情景4 | >0 | >0 | 100 | 0 |
| 情景5 | <0 | <0 | 0 | 100 | |
| 情景6 | <0 | >0 | 共同作用 | 共同作用 |
Fig. 11 The relative effects of climate change and human activity on vegetation change in the Qinghai-Tibet Plateau图11 气候变化和人类活动对植被变化相对作用的区分 |
| [1] |
[
|
| [2] |
[
|
| [3] |
[
|
| [4] |
[
|
| [5] |
[
|
| [6] |
[
|
| [7] |
[
|
| [8] |
|
| [9] |
[
|
| [10] |
[
|
| [11] |
[
|
| [12] |
[
|
| [13] |
[
|
| [14] |
[
|
| [15] |
[
|
| [16] |
[
|
| [17] |
[
|
| [18] |
[
|
| [19] |
[
|
| [20] |
[
|
| [21] |
[
|
| [22] |
[
|
| [23] |
[
|
| [24] |
[
|
| [25] |
[
|
| [26] |
[
|
| [27] |
[
|
| [28] |
[
|
| [29] |
[
|
| [30] |
[
|
| [31] |
[
|
| [32] |
[
|
| [33] |
[
|
/
| 〈 |
|
〉 |