
近30年来洞庭湖地区水稻种植面积演变的影响因素分析
米胜渊(1994- ),男,陕西延安人,硕士,主要从事土地资源利用与管理信息技术研究。E-mail: msy4651@163.com
收稿日期: 2019-04-25
要求修回日期: 2019-07-29
网络出版日期: 2020-12-28
基金资助
国家自然科学基金项目(41601097,41571168)
湖南省哲学社会科学基金项目(18ZDB015)
湖南省教育厅科学研究重点项目(18A102)
Analysis of influencing factors of rice planting area evolution in Dongting Lake Area during 1987-2017
Received date: 2019-04-25
Request revised date: 2019-07-29
Online published: 2020-12-28
Copyright
研究多熟制水稻面积时空演变及驱动机制对保障我国粮食生产和安全具有重要意义。综合运用Nich指数和地理探测器模型,探讨了洞庭湖地区1987—2017年一季稻和双季稻种植面积的时空动态变化及主要影响因素。结果表明:(1)近30年来,位于丘岗山地区的一季稻面积比例大于中部平原地区,整体呈上升的变化趋势;武陵区、沅江市等地在2007—2017年呈先降后升的变化趋势。(2)1987—2002年间一季稻和双季稻面积相对变化率呈西高东低的梯度型变化模式;2002—2017年间一季稻呈高—低—高的条带状变化模式,双季稻呈北高南低的变化发展模式。(3)1987年和2017年地理探测模型结果表明,有效灌溉面积、工业从业人员、农业从业人员、农林牧渔总产值对水稻面积影响程度不断加深。研究结果可为水稻种植结构调整提供参考依据。
米胜渊 , 谭雪兰 , 谭杰扬 , 蒋凌霄 , 王振凯 . 近30年来洞庭湖地区水稻种植面积演变的影响因素分析[J]. 自然资源学报, 2020 , 35(10) : 2499 -2510 . DOI: 10.31497/zrzyxb.20201015
It is of great significance to study the spatial and temporal evolution and driving mechanism of multi-cropping rice area to ensure Chinese grain production and security. The Nich index and geo-detector model were used to explore the spatial and temporal dynamics and main influencing factors of one-cropping rice and double-cropping rice planting in Dongting Lake Area from 1987 to 2017. The results show that: (1) In the past 30 years, the proportion of one cropping rice in the hilly area was greater than that in the central plain, and the overall trend was increasing; with a tendency to decrease first and then increase in Wuling district, Yuanjiang city and other places from 2007 to 2017. (2) From 1987 to 2002, the relative development rates of the area of one-cropping rice and double-cropping rice showed a high gradient pattern in the west and low in the east. From 2002 to 2017, one-cropping rice showed a high-low-high banding pattern, while double-cropping rice showed a pattern of high in the north and low in the south. (3) The results of geo-detector models in 1987 and 2017 showed that the effect of effective irrigation area, industrial workers, agricultural workers, and the total output value of agriculture, forestry, animal husbandry and fishery exerted influence on rice area. This research results provide a basis for optimizing the adjustment of rice planting structure.
Key words: rice area; space-time dynamics; influencing factors; geo-detector; Dongting Lake
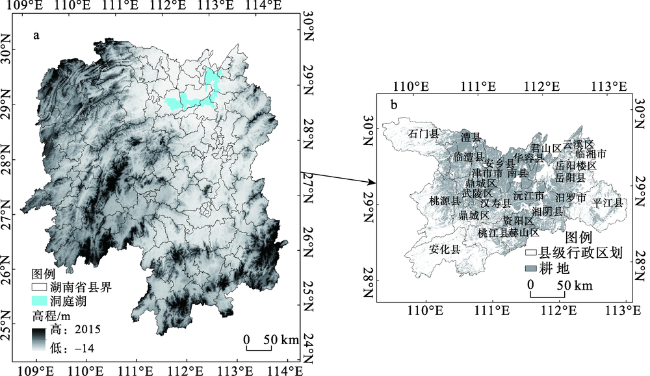
Fig. 1 Location of the study area and the schematic map of cultivated land distribution图1 研究区位置及耕地分布示意 |
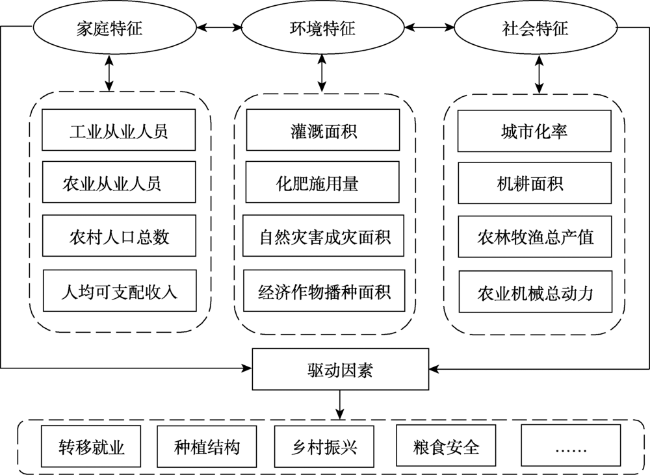
Fig. 2 The concept framework of rice area impact mechanism图2 水稻面积影响机制概念框架 |
Table 1 Types of interaction between two covariates表1 自变量对因变量的交互作用类型 |
| 图示 | 判据 | 交互作用 |
|---|---|---|
 | q(x1∩x2)<min[q(x1), q(x2)] | 非线性减弱 |
 | min[q(x1), q(x2)]<q(x1∩x2)<max[q(x1), q(x2)] | 单因子非线性减弱 |
 | q(x1∩x2)>max[q(x1), q(x2)] | 双因子增强 |
 | q(x1∩x2)=q(x1)+q(x2) | 独立 |
 | q(x1∩x2)>q(x1)+q(x2) | 非线性增强 |
注:min[q(x1), q(x2)] 表示在q(x1)、q(x2) 两者取最小值;q(x1)+q(x2) 表示q(x1)、q(x2) 两者求和;max[q(x1), q(x2)] 表示在q(x1)、q(x2) 两者取最大值;q(x1∩x2) 表示q(x1)、q(x2) 两者交互。 |
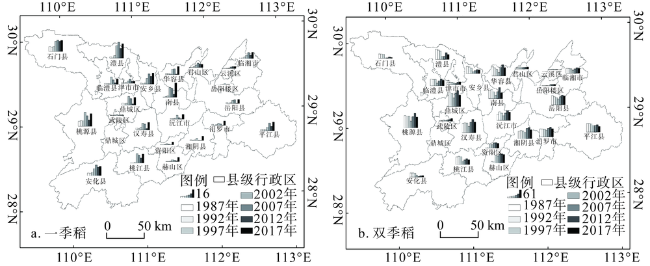
Fig. 3 The change of single cropping rice area and double cropping rice area in Dongting Lake Area from 1987 to 2017图3 1987—2017年洞庭湖地区一季稻面积和双季稻面积变化幅度 |
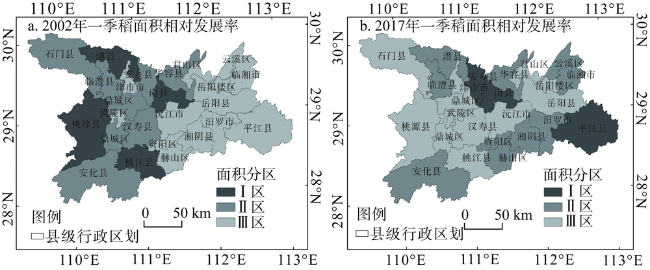
Fig. 4 The spatial distribution of Nich index of single cropping rice area in Dongting Lake in 1987 and 2002图4 2002年和2017年洞庭湖地区一季稻面积相对发展率的空间布局 |
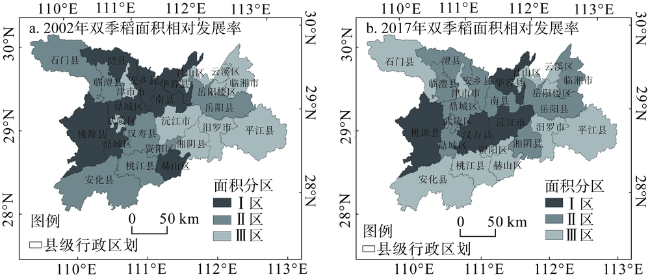
Fig. 5 The spatial distribution of Nich index of double cropping rice area in Dongting Lake in1987 and 2002图5 2002年和2017年洞庭湖地区双季稻面积相对发展率的空间布局 |
Table 2 Detected result of impact factors of rice planting area in Dongting Lake Area in 1987 and 2017表2 1987年和2017年洞庭湖地区水稻种植面积影响因子的地理探测结果 |
| 驱动因素 | 探测因子 | q值 | |
|---|---|---|---|
| 1987年 | 2017年 | ||
| 环境特征 | x1 | 0.58*** | 0.76*** |
| x2 | 0.05* | 0.34** | |
| x3 | 0.35** | 0.50*** | |
| x4 | 0.63*** | 0.41** | |
| 家庭特征 | x5 | 0.14* | 0.47*** |
| x6 | 0.38** | 0.50*** | |
| x7 | 0.46*** | 0.50*** | |
| x8 | 0.26* | 0.05* | |
| 社会特征 | x9 | 0.29* | 0.61*** |
| x10 | 0.57*** | 0.67*** | |
| x11 | 0.37** | 0.63*** | |
| x12 | 0.55*** | 0.35** | |
| 主导交互因子 | x7∩x11 | x1∩x9 | |
| 主导交互因子q值 | 0.87 | 0.87 | |
注:*、**、***分别表示在10%、5%、1%的显著性水平下显著相关;其他无相关性。 |
| [1] |
|
| [2] |
|
| [3] |
[
|
| [4] |
[
|
| [5] |
[
|
| [6] |
[
|
| [7] |
[
|
| [8] |
[
|
| [9] |
|
| [10] |
|
| [11] |
|
| [12] |
[
|
| [13] |
[
|
| [14] |
[
|
| [15] |
[
|
| [16] |
[
|
| [17] |
[
|
| [18] |
[
|
| [19] |
[
|
| [20] |
[
|
| [21] |
[
|
| [22] |
[
|
| [23] |
[
|
| [24] |
[
|
| [25] |
[
|
| [26] |
[
|
| [27] |
[
|
| [28] |
[
|
| [29] |
[
|
| [30] |
[
|
| [31] |
[
|
/
| 〈 |
|
〉 |