
耕地地块细碎程度及其对山区农业生产成本的影响
作者简介:王亚辉(1989- ),男,安徽亳州人,博士,讲师,主要从事土地利用变化研究。E-mail: wangyhui.15b@igsnrr.ac.cn
收稿日期: 2019-07-12
要求修回日期: 2019-09-24
网络出版日期: 2019-12-28
基金资助
教育部人文社会科学研究青年基金项目(19XJCZH006)
国家自然科学基金项目(41901232,41571095)
重庆市社会科学规划项目(2018BS59)
中央高校基本科研业务费项目(swu118054)
Characteristics of cropland fragmentation and its impact on agricultural production costs in mountainous areas
Received date: 2019-07-12
Request revised date: 2019-09-24
Online published: 2019-12-28
Copyright
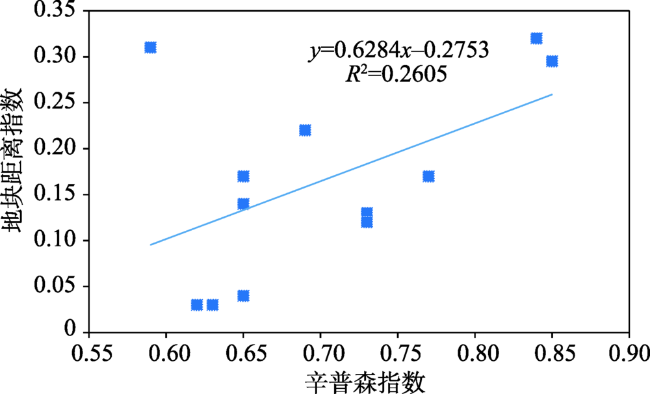
在务农成本持续上涨和省工性技术普及的背景下,山区地块细碎化逐渐成为抑制农民增收的重要因素。厘清山区耕地细碎程度及其对农业生产的影响,对于降低农业生产成本具有指导价值。基于重庆市武隆区、巫山县和酉阳县的1015份农户调研数据,分别从地块权属和空间分布两个角度测算耕地细碎程度,并采用半对数经济计量模型评估耕地细碎差异对农业生产成本的影响。结果表明:研究区耕地细碎程度严重,辛普森指数和地块距离指数分别为0.71和0.19,户均耕地面积6.19亩、地块数8.89块,地块与家庭平均相距430 m,即呈现出“块数多、规模小和距离短”的特征;耕地细碎程度加剧提高了农业生产成本,当辛普森指数和地块距离指数每增加一个标准差时,单位产量总成本依次上升33.8%和16.6%;具体到各单项成本,耕地细碎程度加剧显著提高了劳动力、化肥和种子成本,而限制机械及其他要素的使用。分作物的实证显示,耕地细碎化效应存在明显的作物异质性。此外,优质耕地能缓解地块细碎带来的成本上升,同时扩大地块面积有助于降低生产成本。政策启示:降低农业经营成本是缓解山区耕地撂荒的重要举措,政府应建立低成本的农地流转网络,并鼓励农户或村庄之间的土地互换,提高地块规模和减少耕作距离,同时政府还应推广和普及适合山区农业的微耕机械。
王亚辉 , 李秀彬 , 辛良杰 . 耕地地块细碎程度及其对山区农业生产成本的影响[J]. 自然资源学报, 2019 , 34(12) : 2658 -2672 . DOI: 10.31497/zrzyxb.20191214
Under the background of the continuous increase of agricultural cost and the wide use of labor-saving technology, in the mountainous areas, cropland fragmentation has gradually become a key factor to curb the increase of farmers' income. The clarification of the degree of cropland fragmentation and its impact on agricultural production cost has guiding value for reducing agricultural costs. Degree of cropland fragmentation was measured from the perspective of land ownership and spatial distribution, and the semi-logarithm econometric models were developed to evaluate the impact of land fragmentation on agricultural costs based on the field survey data of 1015 farm households in counties of Wulong, Wushan and Youyang of Chongqing, China. The results showed that the cultivated land in the study areas was severely fragmented, with the Simpson Index and the Plot Distance Index being 0.71 and 0.19, respectively. The cropland area per farm household was 6.19 mu, the number of parcels was 8.89 and the distance between the parcels and families was about 430 m, the characteristics of cropland fragmentation demonstrated "more parcels, small scale and short distance". The increased degree of cropland fragmentation has improved the production cost of agriculture. When the Simpson Index and the Plot Distance Index increased by one standard deviation, the total cost per unit of production increased by 33.8% and 16.6%, respectively. To be specific, the increased degree of land fragmentation has significantly increased labor, fertilizer and seed costs, while limiting the use of machinery and other factors. The study further found the heterogeneity in the impact of land fragmentation on production costs in different crops. In addition, high-quality cropland can alleviate the cost increase caused by the fragmentation of the plots, while expanding the scale of the plots will help to reduce production costs. The policy enlightenment was that reducing agricultural operation costs was an important measure to alleviate the cropland abandonment in mountainous areas. The government should establish a low-cost cropland transfer network and encourage land exchange between farmers or villages to expand the size of the plots and reduce the distance of cultivation, and the government should also promote the wide use of micro-farming machinery suitable for mountain agriculture.
Table 1 Sampling status of survey samples表1 调研样本的抽样情况 |
| 县/区 | 乡镇 | 村庄 | 农户 | 地块 | |||
|---|---|---|---|---|---|---|---|
| 数量/户 | 占比/% | 数量/户 | 占比/% | ||||
| 武隆县 | 白马镇、长坝镇 | 车盘村、东升村、鹅冠村、前进村 | 317 | 31.23 | 3460 | 40.96 | |
| 巫山县 | 龙溪镇、福田镇 | 老鸦村、莲花村、双河村、双塘村 | 374 | 36.85 | 3095 | 36.65 | |
| 酉阳县 | 木叶乡、毛坝乡 | 大板营村、梨耳村、双龙村、天苍村 | 324 | 31.92 | 1892 | 22.39 | |
Fig. 1 Relationship between Simpson Index and Plot Distance Index图1 辛普森指数与地块距离指数之间的关系 |
Table 2 Statistical descriptions of the variables表2 变量的统计性描述 |
| 变量 | 代码 | 单位 | 平均值 | 标准差 | 最小值 | 最大值 | 样本量 |
|---|---|---|---|---|---|---|---|
| 总成本 | TC | 元/t | 784.55 | 622.22 | 64.20 | 6498.81 | 950 |
| 劳动力成本 | LC | 元/t | 458.24 | 408.59 | 22.93 | 4252.63 | 950 |
| 化肥成本 | FC | 元/t | 145.97 | 121.74 | 0.20 | 2010.00 | 950 |
| 种子成本 | SC | 元/t | 104.64 | 254.61 | 2.20 | 5062.67 | 950 |
| 机械等其他成本 | MC | 元/t | 75.70 | 206.30 | 0 | 3198.00 | 950 |
| 核心解释变量 | |||||||
| 辛普森指数 | si | — | 0.71 | 0.18 | 0 | 0.97 | 950 |
| 地块距离指数 | pdi | — | 0.19 | 0.34 | 0 | 1.00 | 950 |
| 耕地经营规模 | Area | 亩 | 6.19 | 4.92 | 0.08 | 33.40 | 950 |
| 户主特征 | |||||||
| 户主年龄 | Age | 岁 | 54.95 | 12.18 | 19.00 | 84.00 | 950 |
| 户主健康状况 | Health | — | 3.31 | 0.81 | 1.00 | 4.00 | 950 |
| 户主受教育程度 | Edu | — | 5.83 | 2.98 | 0 | 15.00 | 950 |
| 是否参加过农业培训 | Atrain | — | 0.22 | 0.42 | 0 | 1.00 | 950 |
| 家庭特征 | |||||||
| 劳动力成本 | Flabor | 元/日 | 78.23 | 43.11 | 34.20 | 220.32 | 950 |
| 家庭有效劳动力数量 | Nlabor | — | 3.09 | 1.18 | 0 | 7.00 | 950 |
| 是否能够贷款 | Finance | — | 0.35 | 0.48 | 0 | 1.00 | 950 |
| 家庭固定资产总额 | Fixedasset | 元 | 4628.58 | 13152.82 | 10.00 | 167480 | 950 |
| 地块特征 | |||||||
| 地块质量等级 | Lquality | — | 3.41 | 0.76 | 1.00 | 5.00 | 8447 |
| 地块灌溉条件 | Irrigation | — | 0.47 | 0.50 | 0 | 1.00 | 8447 |
| 地块微地貌类型 | Topography | — | 0.28 | 0.45 | 0 | 1.00 | 8447 |
注:① 总成本包括劳动力、化肥、种子和机械等成本;劳动力包括家庭劳动和雇佣劳动,具体细分为划土、育苗、播种、插秧、施底肥、追肥、除草、中耕、收割、脱粒、晾晒及秸秆处理用工等。② 化肥包括化学肥料和有机肥,根据当年市场上的销售价进行调整,复合肥为1元/斤、高效复合肥1.5元/斤、磷肥0.5元/斤、氮肥0.45元/斤、尿素1.25元/斤;有机肥料中清粪为20元/t、干粪0.35元/斤。③ 种子单价按照当年市场价进行折算,玉米14元/斤、水稻25元/斤、薯类0.7元/斤、土豆0.6元/斤、棉花9元/斤、大豆2.74元/斤、花生4.6元/斤、油菜23元/斤、中药材23元/斤。 |
Table 3 Characteristics of cropland fragmentation in the surveyed villages表3 调研村土地细碎化特征 |
| 县 | 村 | 辛普森指数 | 地块距离指数 | 户均地块数/块 | 户均规模/亩 | 块均规模/亩 | 地块与家庭距离/m | |||||||||||
|---|---|---|---|---|---|---|---|---|---|---|---|---|---|---|---|---|---|---|
| 均值 | 方差 | 均值 | 方差 | 均值 | 方差 | 均值 | 方差 | 均值 | 方差 | 均值 | 方差 | |||||||
| 武 隆 区 | 车盘村 | 0.59 | 0.21 | 0.31 | 0.41 | 3.28 | 1.88 | 7.77 | 6.14 | 2.10 | 2.01 | 339.86 | 401.08 | |||||
| 东升村 | 0.84 | 0.05 | 0.32 | 0.09 | 13.83 | 5.61 | 9.59 | 4.50 | 0.73 | 0.64 | 455.13 | 412.22 | ||||||
| 鹅冠村 | 0.85 | 0.05 | 0.30 | 0.09 | 14.36 | 5.72 | 8.60 | 3.50 | 0.65 | 0.52 | 323.01 | 325.73 | ||||||
| 前进村 | 0.65 | 0.06 | 0.04 | 0.07 | 14.16 | 6.46 | 8.18 | 5.64 | 0.63 | 0.55 | 450.65 | 461.92 | ||||||
| 巫 山 县 | 老鸦村 | 0.65 | 0.06 | 0.17 | 0.27 | 9.58 | 4.49 | 5.19 | 2.79 | 0.55 | 0.36 | 267.86 | 232.94 | |||||
| 莲花村 | 0.63 | 0.10 | 0.03 | 0.35 | 6.18 | 2.57 | 2.25 | 1.60 | 0.38 | 0.32 | 492.19 | 482.65 | ||||||
| 双河村 | 0.77 | 0.07 | 0.17 | 0.23 | 11.91 | 6.41 | 5.96 | 3.08 | 0.51 | 0.46 | 444.94 | 469.71 | ||||||
| 双塘村 | 0.69 | 0.07 | 0.22 | 0.31 | 7.62 | 3.16 | 3.54 | 2.01 | 0.45 | 0.27 | 371.13 | 343.38 | ||||||
| 酉 阳 县 | 大板营村 | 0.73 | 0.11 | 0.13 | 0.17 | 7.96 | 4.19 | 4.25 | 3.39 | 0.53 | 0.56 | 552.90 | 407.34 | |||||
| 梨耳村 | 0.65 | 0.10 | 0.14 | 0.24 | 6.03 | 2.78 | 7.53 | 5.31 | 1.30 | 1.26 | 534.81 | 506.59 | ||||||
| 双龙村 | 0.73 | 0.09 | 0.12 | 0.18 | 6.88 | 2.51 | 8.11 | 5.08 | 1.20 | 1.03 | 528.08 | 425.28 | ||||||
| 天苍村 | 0.62 | 0.15 | 0.03 | 0.29 | 4.76 | 2.09 | 4.16 | 2.91 | 0.89 | 0.81 | 409.53 | 399.28 | ||||||
| 合计 | 0.71 | 0.11 | 0.19 | 0.23 | 8.89 | 4.79 | 6.19 | 4.08 | 0.81 | 0.72 | 430.75 | 420.21 | ||||||
注:数据来源2014年7-8月重庆三县实地调研数据,经作者整理所得。 |
Table 4 Impact of cropland fragmentation on total agricultural costs表4 耕地细碎程度差异对农业总成本的影响 |
| 变量 | 变量系数 | T值 | 变量系数 | T值 |
|---|---|---|---|---|
| si | 0.338** | 2.06 | ||
| pdi | 0.166** | 2.07 | ||
| Area | -0.08* | -1.83 | -0.02 | -0.05 |
| Health | -0.022 | -0.86 | -0.006 | -0.17 |
| Age | -0.002 | -0.01 | -0.002 | -0.77 |
| Edu | -0.002 | -0.26 | 0.004 | 0.62 |
| Atrain | -0.032 | -0.73 | -0.044 | -0.89 |
| Flabor | 0.047* | 1.69 | 0.054 | 1.34 |
| Nlabor | -0.011 | -0.64 | 0.007 | 0.35 |
| Finance | -0.100** | -2.38 | -0.152*** | -3.02 |
| log(Fixedasset) | -0.038*** | -2.80 | -0.028* | -1.74 |
| region dummies | Yes | Yes | ||
| F-value | 5.81 | 3.62 | ||
| Prob>F | 0.000 | 0.000 | ||
| R2 | 0.071 | 0.050 | ||
| Number of observations | 950 | 950 | ||
注:(1)被解释变量为单位产量总成本;(2)*、**、***分别在10%、5%和1%显著水平下显著;(3)限于篇幅,区位虚拟变量和常数项均未报告;(4)模型处理采用STATA 13.0,下同。 |
Table 5 Impact of cropland fragmentation on single cost for agricultural production表5 耕地细碎程度差异对单项生产成本的影响 |
| 变量 | 劳动力 | 化肥 | 种子 | 机械及其他 | 劳动力 | 化肥 | 种子 | 机械及其他 |
|---|---|---|---|---|---|---|---|---|
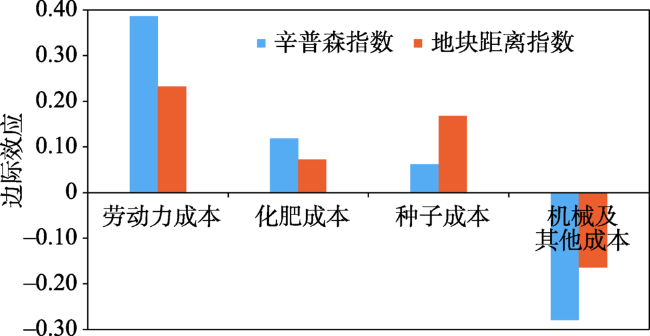
| si | 0.386** | 0.118*** | 0.062 | -0.279 | ||||
| (2.17) | (3.28) | (0.30) | (-0.69) | |||||
| pdi | 0.232* | 0.072*** | 0.168*** | -0.164** | ||||
| (1.76) | (3.20) | (3.31) | (-2.01) | |||||
| Area | -0.003 | -0.007*** | -0.001 | -0.003 | 0.004 | -0.005*** | 0.008 | -0.014 |
| (-0.63) | (-5.20) | (-0.27) | (-0.28) | (0.76) | (-3.30) | (1.47) | (-1.10) | |
| Health | -0.059** | -0.009* | 0.020 | 0.065 | -0.029 | -0.004 | 0.027 | 0.005 |
| (-2.06) | (-1.93) | (0.59) | (0.91) | (-0.77) | (-0.44) | (0.79) | (0.05) | |
| Age | -0.001 | -0.001 | -0.004* | 0.006 | -0.002 | 0.001* | -0.005* | 0.001 |
| (-0.24) | (0.89) | (-1.72) | (1.24) | (-0.76) | (1.66) | (-1.78) | (0.21) | |
| Edu | -0.004 | 0.001 | 0.005 | -0.022 | -0.001 | -0.001 | 0.017** | -0.024 |
| (-0.49) | (-0.46) | (0.62) | (-1.17) | (0.01) | (-0.37) | (1.98) | (-1.07) | |
| Flabor | -0.011 | -0.002 | -0.038** | 0.104** | 0.002 | 0.005 | -0.019 | 0.115** |
| (-0.61) | (-0.66) | (-2.01) | (2.10) | (0.08) | (0.87) | (-0.88) | (1.98) | |
| Finance | 0.122*** | 0.003 | 0.099* | -0.066 | 0.197*** | -0.002 | 0.115* | -0.071 |
| (2.69) | (0.43) | (1.80) | (-0.60) | (3.42) | (-0.15) | (1.93) | (-0.54) | |
| log(Fixedasset) | -0.044*** | 0.001 | -0.031* | 0.021 | -0.027 | -0.003 | -0.032* | 0.019 |
| (-2.83) | (0.23) | (-1.85) | (0.63) | (-1.34) | (-0.83) | (-1.73) | (0.45) | |
| region dummies | Yes | Yes | Yes | Yes | Yes | Yes | Yes | Yes |
| R2 | 0.063 | 0.108 | 0.035 | 0.414 | 0.045 | 0.119 | 0.062 | 0.436 |
| Number of observations | 950 | 950 | 950 | 950 | 950 | 950 | 950 | 950 |
注:(1)限于篇幅,农业技术培训、地理区位和常数项的结果均未报告;(2)在成本分析中,本文也尝试把农药成本单独剥离出来,但未施用农药的地块数量为4992块,占总体地块数的59.1%,酉阳地区则超过80%的地块未施用农药,考虑到绝大多数地块的农药费用为0,回归中存在严重的系数偏误和异质性问题,故本文并未把农药成本单独剥离出来分析。 |
Fig. 2 Marginal effect of land fragmentation on single cost for agricultural production图2 耕地细碎程度对农业单项成本的边际效应 |
Table 6 Impact of cropland fragmentation on total costs for different crops表6 耕地细碎程度差异对不同农作物生产成本的影响 |
| 变量 | 玉米 | 薯类 | 水稻 | 水稻 | 玉米 | 薯类 | 水稻 | 水稻 |
|---|---|---|---|---|---|---|---|---|
| si | 0.540*** | 0.402*** | 0.553 | 0.582* | ||||
| (3.52) | (4.82) | (1.47) | (1.83) | |||||
| pdi | 0.183*** | 0.236*** | -0.089 | -0.069 | ||||
| (2.85) | (2.92) | (-0.66) | (-0.44) | |||||
| Lquality | -0.050*** | -0.113*** | -0.094*** | -0.048*** | -0.113*** | -0.092*** | ||
| (-2.83) | (-4.62) | (-3.39) | (-2.72) | (-4.61) | (-3.32) | |||
| Irrigation | -0.095*** | -0.041 | -0.177*** | -0.100*** | -0.052 | -0.177*** | ||
| (-3.25) | (-1.13) | (-4.01) | (-3.43) | (-1.41) | (-3.99) | |||
| Topography | -0.005 | -0.007 | 0.167*** | 0.001 | -0.003 | 0.175*** | ||
| (-0.15) | (-0.15) | (3.16) | (0.04) | (-0.07) | (3.31) | |||
| Areap | -0.361*** | -0.469*** | -0.477*** | -0.476*** | -0.357*** | -0.477*** | -0.470*** | -0.467*** |
| (-11.27) | (-7.33) | (-6.35) | (-6.81) | (-10.82) | (-7.47) | (-6.13) | (-6.69) | |
| Square of Areap | 0.036*** | 0.093*** | 0.072*** | 0.073*** | 0.037*** | 0.102*** | 0.072*** | 0.073*** |
| (5.87) | (4.44) | (3.82) | (4.36) | (5.59) | (4.97) | (3.65) | (4.37) | |
| Nlabor | 0.041*** | -0.021 | -0.002 | 0.007 | 0.040*** | -0.025 | -0.004 | 0.005 |
| (3.36) | (-1.31) | (-0.11) | (0.32) | (3.26) | (-1.58) | (-0.22) | (0.22) | |
| Finance | 0.088*** | 0.051 | -0.047 | -0.067 | 0.091*** | 0.064* | -0.046 | -0.067 |
| (3.06) | (1.48) | (-0.98) | (-1.41) | (3.14) | (1.83) | (-0.95) | (-1.38) | |
| log(Fixedasset) | -0.029*** | -0.027** | -0.015 | -0.009 | -0.031*** | -0.028** | -0.020 | -0.014 |
| (-2.92) | (-2.34) | (-0.83) | (-0.50) | (-3.09) | (-2.46) | (-1.11) | (-0.81) | |
| region dummies | Yes | Yes | Yes | Yes | Yes | Yes | Yes | Yes |
| R2_adj | 0.111 | 0.118 | 0.152 | 0.118 | 0.109 | 0.112 | 0.149 | 0.114 |
| Number of observations | 2691 | 1928 | 854 | 854 | 2691 | 1928 | 854 | 854 |
注:户主年龄、健康状况、户主受教育程度及农业技术培训纳入模型均不显著,剔除之后对其他变量的系数和显著性并无较大改变,限于篇幅,故未报告。 |
Table 7 Effect of farmland fragmentation on single cost for different crops表7 耕地细碎程度差异对不同农作物各单项成本的影响 |
| 农作物 | 变量 | 劳动力 | 化肥 | 种子 | 机械及其他 | 劳动力 | 化肥 | 种子 | 机械及其他 |
|---|---|---|---|---|---|---|---|---|---|
| 玉米 | si | 0.575*** | -0.237 | 0.123*** | -0.506 | ||||
| (3.57) | (-0.82) | (4.12) | (-1.16) | ||||||
| pdi | 0.210*** | -0.038 | 0.203*** | -0.051 | |||||
| (3.12) | (-0.37) | (2.92) | (-0.27) | ||||||
| 薯类 | si | 0.350** | 0.181*** | 0.153*** | 0.553 | ||||
| (2.21) | (3.82) | (6.73) | (1.60) | ||||||
| pdi | 0.115* | 0.089 | 0.115*** | 0.065*** | |||||
| (1.74) | (0.72) | (3.80) | (3.51) | ||||||
| 水稻 | si | 0.783** | 0.165* | 0.065*** | -0.176 | ||||
| (1.97) | (1.69) | (2.59) | (-1.00) | ||||||
| pdi | -0.042 | -0.095 | -0.028 | 0.404 | |||||
| (-0.33) | (-0.51) | (-0.18) | (0.77) |
注:其他变量也被纳入模型中,受限于篇幅,并未报告。 |
Table 8 Characteristics of the plots for different crops表8 种植不同农作物的地块特征比较 |
| 作物分类 | 一、二等地地块比例/% | 可灌溉地块比例/% | 平坝地块比例/% | 平均地块规模/亩 | 地块与住宅距离/m |
|---|---|---|---|---|---|
| 玉米 | 35.93 | 38.46 | 29.91 | 0.70 | 474.34 |
| 薯类 | 28.94 | 39.09 | 21.68 | 0.61 | 453.94 |
| 水稻 | 64.87 | 51.53 | 66.63 | 0.73 | 535.68 |
| 合计 | 34.23 | 46.78 | 28.36 | 0.69 | 463.34 |
注:资料来源于2014年7-8月重庆三县实地调研数据,并通过作者整理所得。 |
| [1] |
[
|
| [2] |
[
|
| [3] |
|
| [4] |
|
| [5] |
[
|
| [6] |
[
|
| [7] |
[
|
| [8] |
[
|
| [9] |
[
|
| [10] |
[
|
| [11] |
[
|
| [12] |
|
| [13] |
[
|
| [14] |
|
| [15] |
|
| [16] |
|
| [17] |
|
| [18] |
|
| [19] |
|
| [20] |
|
| [21] |
[
|
| [22] |
|
| [23] |
|
| [24] |
[
|
| [25] |
[
|
| [26] |
[
|
| [27] |
|
| [28] |
|
| [29] |
|
| [30] |
[
|
| [31] |
[
|
| [32] |
|
| [33] |
[
|
| [34] |
|
| [35] |
|
| [36] |
|
| [37] |
[
|
| [38] |
|
/
| 〈 |
|
〉 |