
中亚跨境流域生态脆弱性评价及其时空特征分析——以阿姆河流域为例
作者简介:陈桃(1990- ),男,四川资阳人,硕士,研究方向为生态环境遥感。E-mail: chentao16@mails.ucas.ac.cn
收稿日期: 2019-04-20
要求修回日期: 2019-08-28
网络出版日期: 2019-12-28
基金资助
中国科学院战略性先导科技专项(XDA20030101)
亚欧大陆干旱带荒漠化研究(131965KYSB2017 0038)
Ecological vulnerability assessment for a transboundary basin in Central Asia and its spatiotemporal characteristics analysis: Taking Amu Darya River Basin as an example
Received date: 2019-04-20
Request revised date: 2019-08-28
Online published: 2019-12-28
Copyright
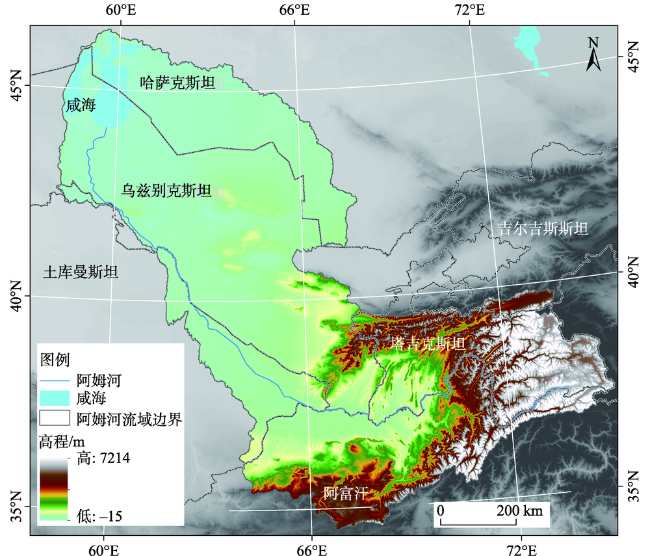
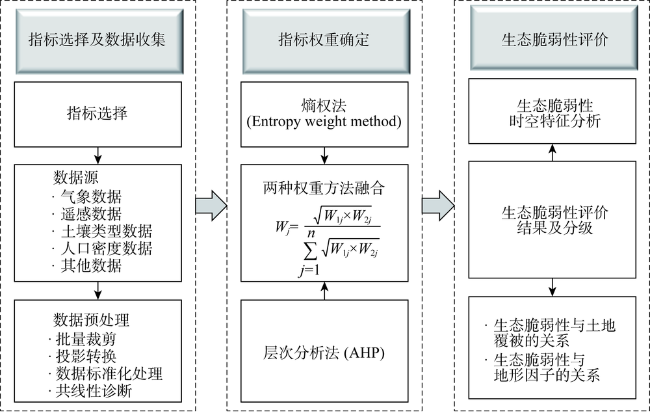
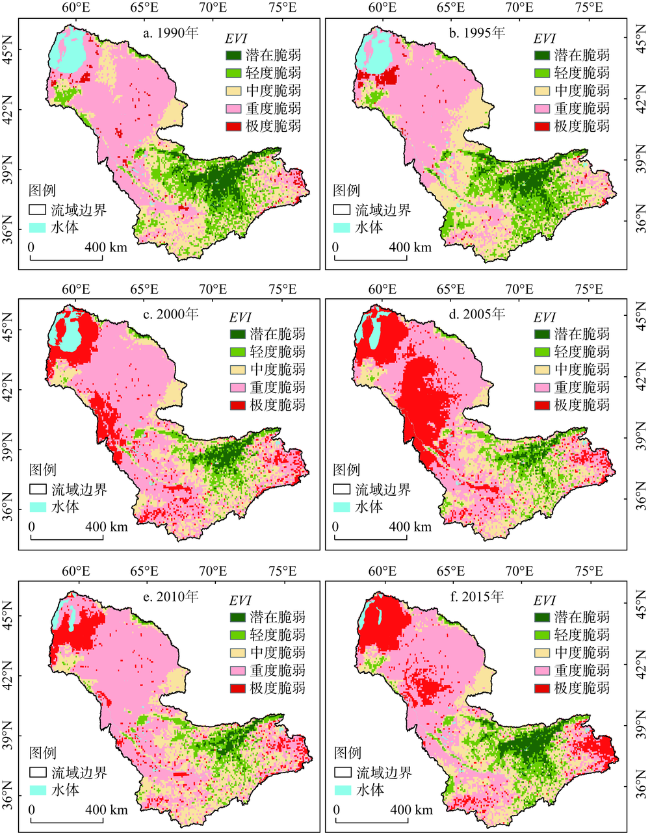
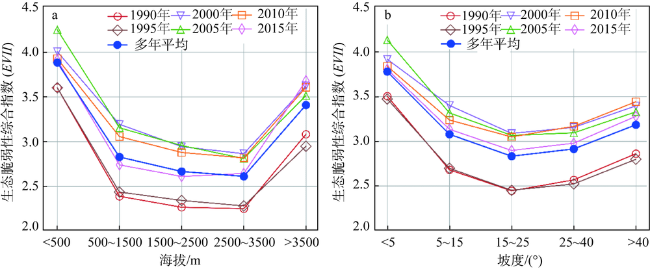
生态脆弱性(EVI)的定量评估和长期分析,对于了解区域生态环境动态变化与指导生态环境保护与修复极为重要。但以往研究很少对跨境流域这一特殊单元进行生态脆弱性评价。以阿姆河流域为例,选择反映研究区植被、水文、气候、地形、土壤以及人类活动等方面的11个指标,通过共线性诊断分析,构建了阿姆河流域生态脆弱性评价体系,利用主观权重与客观权重相结合的方法确定指标权重,对1990-2015年研究区EVI进行了定量评价及时空特征分析。结果表明:(1)研究区生态环境呈恶化趋势,大部分区域处于重度脆弱状态,研究时段内重度脆弱性比例的平均值为46.40%;极度脆弱性占比在过去25年内呈增加趋势,从1990年的2.58%增加至2015年的16.97%,增幅为14.39%。(2)生态脆弱性在不同土地覆被类型之间差异巨大,其中草地的EVI值变化最大,裸地的生态环境最为脆弱,林地的生态脆弱性最小;研究区生态脆弱程度整体表现为裸地>灌丛>草地>耕地>城市用地>林地的规律。(3)EVI与地形因子的关系表明生态环境最为脆弱的区域主要位于低海拔地势平坦与高海拔坡度大的地区,而低脆弱性主要分布在海拔2500~3500 m或坡度15~25°的区间上。
陈桃 , 包安明 , 郭浩 , 郑国雄 , 袁野 , 于涛 . 中亚跨境流域生态脆弱性评价及其时空特征分析——以阿姆河流域为例[J]. 自然资源学报, 2019 , 34(12) : 2643 -2657 . DOI: 10.31497/zrzyxb.20191213
Quantitative assessment and long-term analysis of ecological vulnerability (EVI) are greatly important for understanding the dynamics of regional ecological environment and guiding ecological environmental protection and restoration. However, in the previous studies, there was rare assessment for ecological vulnerability of the special area of a transboundary basin. In this paper, the Amu Darya River Basin was used as the study area and 11 indicators were selected to reflect the vegetation, hydrology, climate, topography, soil and human activities. After the collinearity diagnostics, an ecological vulnerability assessment system for the study area was constructed. Further, subjective weight method and objective weight method was combined to determine the weight of all indexes, and quantitative estimation for the ecological vulnerability and the spatiotemporal characteristics analysis of the study area from 1990 to 2015 were conducted. The results showed that: (1) The ecological environment of the study area showed a deteriorating trend, and most of the areas were in a heavy vulnerable situation; the average proportion of heavy vulnerability during the study period was 46.40%. The proportion of extreme vulnerability also increased from 2.58% in 1990 to 16.97% in 2015, an increase of 14.39% over the past 25 years. (2) The ecological vulnerability of the study area varied greatly among different land cover types. The EVI value of grassland changed the most, the ecological environment of bare land was the most vulnerable, and the ecological vulnerability of forest was the lowest. In all, the ecological vulnerability levels among different land cover types were in an oreder of bare land > shrub > grassland > cropland > urban land > forest. (3) The relationship between EVI and topographical factors indicated that the area with lower elevation and smaller slope or higher elevation and larger slope was the most vulnerable regions, while the area with low vulnerability was mainly distributed in the regions at an altitude of 2500-3500 m or on a slope of 15-25°.
Fig. 1 Location of Amu Darya River Basin图1 阿姆河流域位置 |
Fig. 2 Flowchart for the assessment of ecological vulnerability图2 生态脆弱性评估技术流程 |
Table 1 Results of multi-collinearity diagnostics for all indexes表1 指标共线性诊断结果 |
| 指标 | VIF值 | |||||
|---|---|---|---|---|---|---|
| 1990年 | 1995年 | 2000年 | 2005年 | 2010年 | 2015年 | |
| 高程 | 8.042 | 9.149 | 7.438 | 9.195 | 8.089 | 7.659 |
| 坡度 | 2.919 | 2.939 | 2.941 | 2.944 | 2.910 | 2.976 |
| NDVI | 1.953 | 1.874 | 2.061 | 1.969 | 2.156 | 2.019 |
| 降水 | 4.983 | 5.753 | 4.797 | 6.644 | 7.804 | 4.332 |
| 温度 | 4.936 | 6.458 | 5.216 | 6.091 | 6.089 | 6.442 |
| SPEI | 1.081 | 1.225 | 1.567 | 1.997 | 3.349 | 1.937 |
| 土壤有机质 | 2.167 | 2.238 | 2.186 | 2.222 | 2.165 | 2.266 |
| 景观破碎度 | 1.098 | 1.095 | 1.099 | 1.089 | 1.104 | 1.108 |
| 灌溉 | 1.348 | 1.352 | 1.380 | 1.241 | 1.314 | 1.292 |
| 河网密度 | 1.219 | 1.189 | 1.220 | 1.261 | 1.225 | 1.223 |
| 人口密度 | 1.155 | 1.155 | 1.069 | 1.069 | 1.068 | 1.062 |
Table 2 Weights of evolution indexes表2 指标权重 |
| 指标 | 指标权重值(Wj) | |||||
|---|---|---|---|---|---|---|
| 1990年 | 1995年 | 2000年 | 2005年 | 2010年 | 2015年 | |
| 高程 | 0.0720 | 0.0718 | 0.0778 | 0.0782 | 0.0776 | 0.0775 |
| 降水 | 0.1362 | 0.1365 | 0.1402 | 0.1457 | 0.1412 | 0.1416 |
| PARA | 0.0824 | 0.0813 | 0.0958 | 0.0960 | 0.0947 | 0.0951 |
| 人口密度 | 0.2241 | 0.2210 | 0.1694 | 0.1718 | 0.1703 | 0.1710 |
| 土壤有机质 | 0.0387 | 0.0384 | 0.0418 | 0.0421 | 0.0417 | 0.0417 |
| SPEI | 0.0656 | 0.0709 | 0.0728 | 0.0636 | 0.0739 | 0.0725 |
| 温度 | 0.0694 | 0.0695 | 0.0719 | 0.0722 | 0.0721 | 0.0721 |
| 灌溉 | 0.0204 | 0.0206 | 0.0223 | 0.0216 | 0.0202 | 0.0201 |
| NDVI | 0.1658 | 0.1645 | 0.1664 | 0.1662 | 0.1675 | 0.1678 |
| 河网密度 | 0.0125 | 0.0125 | 0.0135 | 0.0136 | 0.0135 | 0.0135 |
| 坡度 | 0.1130 | 0.1130 | 0.1280 | 0.1291 | 0.1274 | 0.1271 |
Table 3 Statistical results of different ecological vulnerability levels and ecological vulnerability integrated index in the Amu Darya River Basin from 1990 to 2015表3 1990-2015阿姆河年不同生态脆弱性等级及生态脆弱性综合指数统计结果 |
| 年份 | 潜在脆弱 | 轻度脆弱 | 中度脆弱 | 重度脆弱 | 极度脆弱 | 生态脆弱性综合指数(EVII) | |
|---|---|---|---|---|---|---|---|
| 1990 | 像元数/个 | 863 | 1873 | 3192 | 5357 | 298 | 3.21 |
| 比例/% | 7.23 | 16.21 | 27.62 | 46.36 | 2.58 | ||
| 1995 | 像元数/个 | 730 | 1990 | 3611 | 4946 | 327 | 3.19 |
| 比例/% | 6.29 | 17.15 | 31.12 | 42.62 | 2.82 | ||
| 2000 | 像元数/个 | 387 | 868 | 2529 | 6020 | 1918 | 3.70 |
| 比例/% | 3.3 | 7.41 | 21.57 | 51.36 | 16.36 | ||
| 2005 | 像元数/个 | 236 | 989 | 2650 | 4667 | 3347 | 3.83 |
| 比例/% | 1.99 | 8.32 | 22.29 | 39.25 | 28.15 | ||
| 2010 | 像元数/个 | 255 | 981 | 2934 | 6571 | 1255 | 3.63 |
| 比例/% | 2.13 | 8.18 | 24.46 | 54.77 | 10.46 | ||
| 2015 | 像元数/个 | 635 | 1337 | 2718 | 5303 | 2043 | 3.56 |
| 比例/% | 5.28 | 11.11 | 22.58 | 44.06 | 16.97 | ||
Fig. 3 Spatial distributions of ecological vulnerability levels in the Amu Darya River Basin from 1990 to 2015图3 1990-2015年阿姆河流域生态脆弱性等级空间分布 |
Fig. 4 Analysis of the defferences of ecological vulnerabilities among different land cover types in the Amu Darya Rirver from 1990 to 2015图4 1990-2015年阿姆河流域土地覆被类型的生态脆弱性差异分析 |
Fig. 5 The variations of ecological vulnerability integrated index on different altitudes and slopes in different periods图5 各个时期不同海拔和坡度下生态脆弱性综合指数的变化规律 |
| [1] |
|
| [2] |
[
|
| [3] |
[
|
| [4] |
[
|
| [5] |
|
| [6] |
[
|
| [7] |
|
| [8] |
|
| [9] |
[
|
| [10] |
[
|
| [11] |
[
|
| [12] |
|
| [13] |
|
| [14] |
|
| [15] |
|
| [16] |
|
| [17] |
|
| [18] |
|
| [19] |
|
| [20] |
|
| [21] |
[
|
| [22] |
[
|
| [23] |
|
| [24] |
[
|
| [25] |
|
| [26] |
|
| [27] |
[
|
| [28] |
|
| [29] |
[
|
| [30] |
|
| [31] |
|
| [32] |
|
| [33] |
|
| [34] |
[
|
| [35] |
[
|
| [36] |
[
|
| [37] |
[
|
| [38] |
[
|
| [39] |
[
|
/
| 〈 |
|
〉 |
