
不同情景模式下雄安新区的水资源利用效率和节水潜力分析
作者简介:赵志博(1992- ),女,河北唐山人,博士研究生,研究方向为自然资源与环境经济。E-mail: zhibozhao0728@163.com
收稿日期: 2019-05-12
要求修回日期: 2019-09-20
网络出版日期: 2019-12-28
基金资助
国家自然科学基金项目(71473233)
Analysis of water resources utilization efficiency and water saving potential in Xiong'an New Area under different scenarios
Received date: 2019-05-12
Request revised date: 2019-09-20
Online published: 2019-12-28
Copyright
雄安新区是千年大计、国家大事,水资源短缺与水体污染成为制约其发展的主要问题。从水资源利用效率及节水潜力视角出发,以深圳发展历程为标杆,结合情景分析与方向性距离函数等模型,展示到2035年不同情景的雄安水资源利用效率及节水潜力发展图景和路径。研究表明:从利用效率看,在基准、起步、建成情景下雄安呈现出由低效率区到较高效率区再到高效率区的变化态势。从节水潜力看,效率改善空间减小、技术落差比增加等表明雄安节水潜力得到充分挖掘。杜绝污水直排、积极发展污水处理技术、优化新区产业结构等是促使水资源利用效率提高的有效手段,是雄安实现绿色生态发展的重要保障。
赵志博 , 赵领娣 , 王亚薇 , 袁田 . 不同情景模式下雄安新区的水资源利用效率和节水潜力分析[J]. 自然资源学报, 2019 , 34(12) : 2629 -2642 . DOI: 10.31497/zrzyxb.20191212
Xiong'an New Area is a millennium plan and a national event. Water shortage and water pollution have become the main problems which restrict its development. Different from the existing research on Xiong'an strategic development interpretation and resource profile description, this paper combines with scenario analysis and directional distance function models so as to show the water resources utilization efficiency and water saving potential development landscape and path of different scenarios in 2035 for the first time and it is innovatively based on the development of Shenzhen. The research shows that Xiong'an presents a change from low-efficiency zone to high-efficiency zone to high-efficiency zone in the Business as Usual, Starting Process and Construction Completion scenarios from the perspective of utilization efficiency. From the perspective of water saving potential, the reduction of efficiency improvement space and the increase in metatechnology ratios indicate that water saving potential of Xiong'an has been fully explored. Avoiding direct sewage discharge, developing sewage treatment technology actively and optimizing the industrial structure of the Xiong'an New Area are effective ways to promote the utilization efficiency of water resources, which is also an important guarantee for Xiong'an to realize green ecological development.
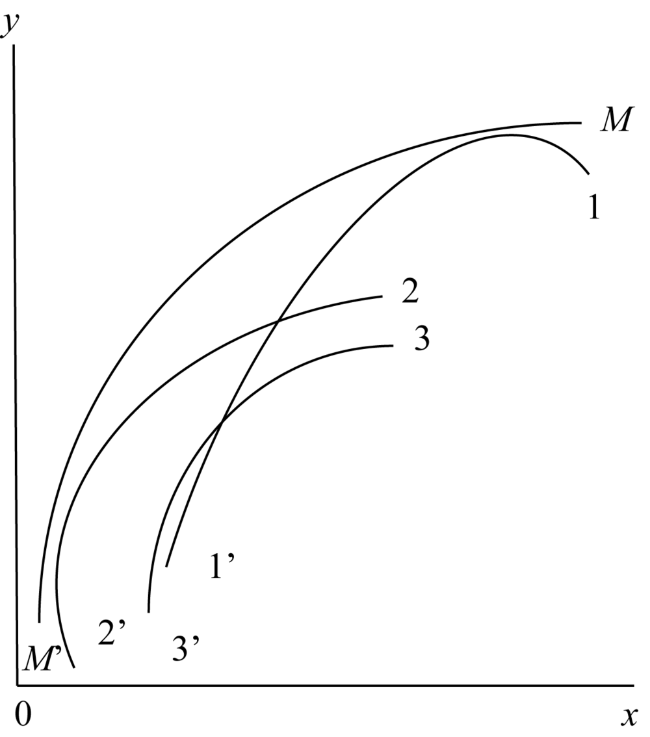
Fig. 1 The metafrontier and the groupfrontier图1 共同前沿与组前沿 |
Table 1 Descriptive statistics of input and output variables表1 投入产出变量描述性统计 |
| 变量 | 单位 | 均值 | 标准差 | 最小值 | 最大值 |
|---|---|---|---|---|---|
| Capital | 百万元 | 180352.2381 | 179348.1044 | 9005.6100 | 1536796.9000 |
| Population | 万人 | 130.1857 | 236.6863 | 14.1000 | 2415.2700 |
| Consumption | 万m3 | 16746.0664 | 32040.2727 | 481.4000 | 312224.4200 |
| GDP | 千万元 | 24683.2569 | 32634.8452 | 659.6530 | 251234.5000 |
| Sewage | 万m3 | 13886.3611 | 25700.9046 | 348.0000 | 230423.0000 |
Table 2 Comparison of Xiong'an New Area under different scenarios表2 雄安新区不同情景的设定与比较 |
| 情景名称 | 情景定义 | 发展展望 |
|---|---|---|
| 基准情景(BAU) | 以2015年为基准年,分析水资源利用现状 | 以2015年的基础数据进行分析 |
| 起步情景(SP) | 将2018-2023年定义为起步情景 | 借鉴深圳设立初期的关键指标*预测雄安新区起步情景发展 |
| 建成情景(CC) | 将2023-2035年定义为建成情景 | 借鉴深圳发展历程中关键指标*预测雄安新区建成情景发展 |
注:*指深圳人均用水量、人均污水排放量、固定资产投资等经济指标。 |
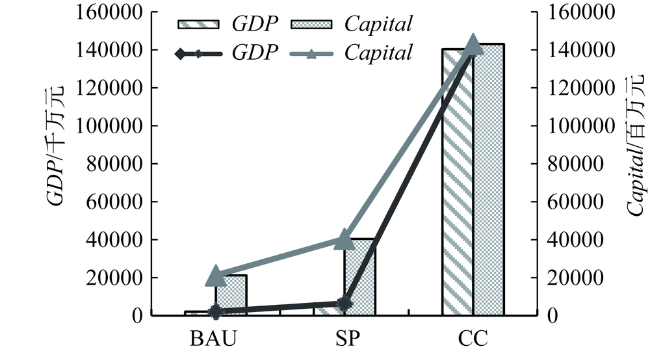
Fig. 2 The trend of fixed asset investment and regional GDP in Xiong'an New Area图2 雄安新区固定资产投资、地区生产总值变动趋势 |
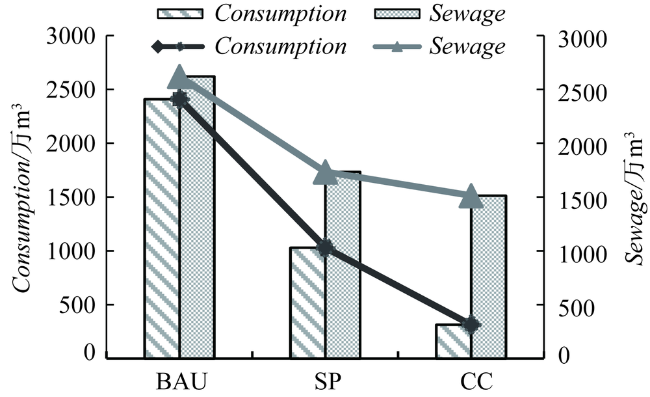
Fig. 3 The trend of total water and total sewage discharge in Xiong'an New Area图3 雄安新区用水总量、污水排放量变动趋势 |
Table 3 Water resources utilization efficiency value and natural breaks classifications of Xiong'an New Area and capitals under the BAU, SP and CC scenarios表3 基准、起步、建成情景下雄安新区与各省省会水资源利用效率值及自然断点分区 |
| 城市(区) | 基准情景 | 起步情景 | 建成情景 | |||||
|---|---|---|---|---|---|---|---|---|
| 效率值 | 自然断点分区 | 效率值 | 自然断点分区 | 效率值 | 自然断点分区 | |||
| 北京 | 0.9791 | IV | 0.9643 | V | 0.7114 | III | ||
| 天津 | 0.7740 | II | 0.6795 | II | 0.6185 | II | ||
| 石家庄 | 0.7078 | I | 0.6580 | II | 0.6012 | I | ||
| 太原 | 0.7144 | II | 0.6111 | I | 0.5615 | I | ||
| 呼和浩特 | 0.8579 | III | 0.8192 | IV | 0.7360 | III | ||
| 沈阳 | 0.7543 | II | 0.9994 | V | 0.6259 | II | ||
| 长春 | 0.7362 | II | 0.6504 | II | 0.6059 | II | ||
| 哈尔滨 | 0.7447 | II | 0.6552 | II | 0.6085 | II | ||
| 上海 | 0.8791 | III | 0.8868 | IV | 0.6056 | II | ||
| 南京 | 0.7609 | II | 0.8923 | IV | 0.8361 | IV | ||
| 杭州 | 0.8110 | III | 0.6984 | III | 0.6026 | I | ||
| 合肥 | 0.7030 | I | 0.6451 | II | 0.5904 | I | ||
| 福州 | 0.9926 | V | 0.6836 | II | 0.6086 | II | ||
| 南昌 | 0.6862 | I | 0.6199 | I | 0.5719 | I | ||
| 济南 | 0.8136 | III | 0.7065 | III | 0.6401 | II | ||
| 郑州 | 0.9522 | IV | 0.9812 | V | 0.6211 | II | ||
| 武汉 | 0.9731 | IV | 0.9722 | V | 0.7081 | III | ||
| 长沙 | 0.7647 | II | 0.9510 | V | 0.7008 | III | ||
| 广州 | 0.9945 | V | 0.9022 | IV | 0.6231 | II | ||
| 南宁 | 0.6673 | I | 0.6291 | II | 0.5764 | I | ||
| 海口 | 0.6635 | I | 0.7628 | III | 1.0000 | V | ||
| 重庆 | 0.6925 | I | 0.6147 | I | 0.5834 | I | ||
| 成都 | 0.9732 | IV | 0.9680 | V | 0.6850 | III | ||
| 贵阳 | 0.6808 | I | 1.0000 | V | 1.0000 | V | ||
| 昆明 | 0.7399 | II | 0.7295 | III | 0.6012 | I | ||
| 西安 | 0.7562 | II | 0.7197 | III | 0.6274 | II | ||
| 兰州 | 0.6880 | I | 0.6436 | II | 0.5991 | I | ||
| 西宁 | 0.6525 | I | 0.5731 | I | 0.5567 | I | ||
| 银川 | 0.9897 | V | 0.6038 | I | 0.5673 | I | ||
| 乌鲁木齐 | 0.7368 | II | 0.8921 | IV | 1.0000 | V | ||
| 雄安 | 0.6869 | I | 0.8347 | IV | 1.0000 | V | ||
注:I、II、III、IV、V分别表示按自然断点法划分的低效率区、较低效率区、中效率区、较高效率区、高效率区。 |
Table 4 Efficiency values and metatechnology ratios for different scenarios and different groups表4 不同情景、不同组别的效率值以及技术落差比 |
| 组别 | GTE | MTE | MTR | |||||
|---|---|---|---|---|---|---|---|---|
| 均值 | 标准差 | 均值 | 标准差 | 均值 | 标准差 | |||
| 东部—基准情景 | 0.8164 | 0.1101 | 0.6729 | 0.0707 | 0.8319 | 0.0850 | ||
| 东部—起步情景 | 0.8098 | 0.1204 | 0.6733 | 0.0893 | 0.8414 | 0.1122 | ||
| 东部—建成情景 | 0.8468 | 0.1560 | 0.7064 | 0.1370 | 0.8468 | 0.1364 | ||
| 中部—基准情景 | 0.7971 | 0.1152 | 0.6488 | 0.0512 | 0.8243 | 0.0882 | ||
| 中部—起步情景 | 0.7926 | 0.1309 | 0.6434 | 0.0593 | 0.8236 | 0.0816 | ||
| 中部—建成情景 | 0.8684 | 0.1495 | 0.6848 | 0.1158 | 0.8013 | 0.1244 | ||
| 西部—基准情景 | 0.6708 | 0.0863 | 0.6598 | 0.0757 | 0.9855 | 0.0284 | ||
| 西部—起步情景 | 0.7086 | 0.1448 | 0.6670 | 0.0946 | 0.9555 | 0.0911 | ||
| 西部—建成情景 | 0.7491 | 0.1662 | 0.7175 | 0.1495 | 0.9697 | 0.1253 | ||
| 东部整体 | 0.8243 | 0.1313 | 0.6842 | 0.1041 | 0.8400 | 0.1133 | ||
| 中部整体 | 0.8194 | 0.1371 | 0.6590 | 0.0828 | 0.8164 | 0.1004 | ||
| 西部整体 | 0.7095 | 0.1404 | 0.6814 | 0.1140 | 0.9702 | 0.0918 | ||
| 雄安—基准情景 | 0.5789 | 0.5586 | 0.9649 | |||||
| 雄安—起步情景 | 0.6536 | 0.6270 | 0.9593 | |||||
| 雄安—建成情景 | 1.0000 | 1.0000 | 1.0000 | |||||
| [1] |
[
|
| [2] |
[
|
| [3] |
[
|
| [4] |
[
|
| [5] |
[
|
| [6] |
[
|
| [7] |
|
| [8] |
[
|
| [9] |
|
| [10] |
[
|
| [11] |
|
| [12] |
|
| [13] |
|
| [14] |
|
| [15] |
|
| [16] |
|
| [17] |
|
| [18] |
|
| [19] |
|
| [20] |
[
|
| [21] |
|
| [22] |
[
|
| [23] |
|
| [24] |
|
| [25] |
|
| [26] |
|
| [27] |
中共中央国务院关于对《河北雄安新区规划纲要》的批复. 人民日报, 2018-04-21(001).
[CPC Central Committee and State Council's reply to the "Planning Outline for Hebei Xiong'an New Area". People's Daily, 2018-04-21(001).]
|
/
| 〈 |
|
〉 |