
湿地要素中碳氮同位素特征与水文连通的关系
作者简介:郭雨桐(1994- ),女,黑龙江齐齐哈尔人,硕士,研究方向为湿地植物—土壤系统碳过程。E-mail: 835758788@qq.com
收稿日期: 2019-06-14
要求修回日期: 2019-10-19
网络出版日期: 2019-12-28
基金资助
国家重点研发计划项目(2017YFC0505903)
国家自然科学基金项目(51609005)
北京林业大学青年教师科学研究中长期项目(2015ZCQ-BH-01)
Distribution characteristics of carbon and nitrogen stable isotopes in wetland components and their relationship with wetland hydrological connectivity
Received date: 2019-06-14
Request revised date: 2019-10-19
Online published: 2019-12-28
Copyright
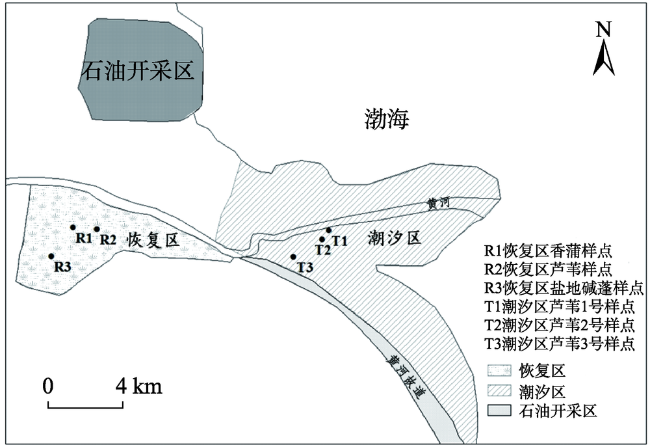
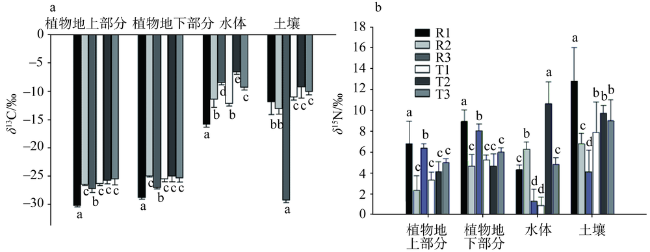
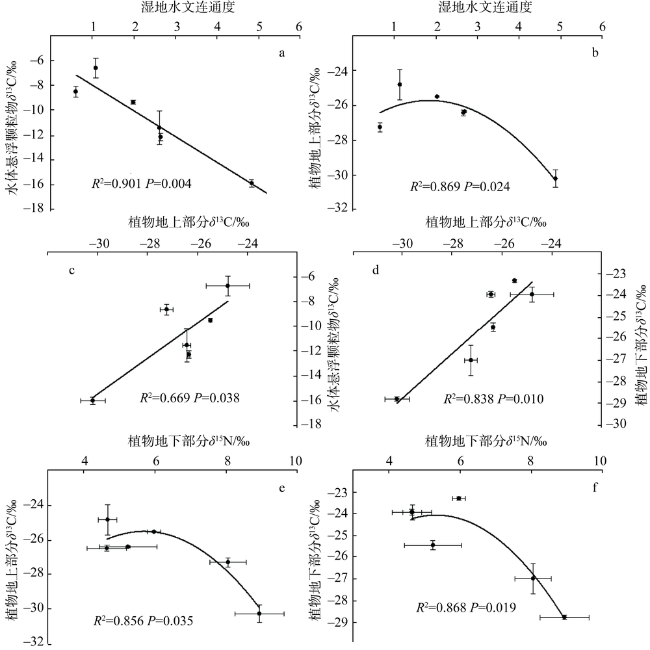
为探究湿地三要素中碳氮稳定同位素分布特征与湿地水文连通的关系,选取黄河三角洲恢复区和潮汐区湿地典型样点,分析样点水文连通度、植物/土壤/水体悬浮颗粒物中碳氮稳定同位素分布特征及水文连通度与碳氮稳定同位素间的关系。结果表明:恢复区芦苇(Phragmite australis)、香蒲(Typha orientalis)和盐地碱蓬(Suaeda salsa)三种植物地上及地下部分δ13C值存在显著差异。恢复区芦苇湿地水体悬浮颗粒物中的δ13C值比潮汐区芦苇湿地的更低。潮汐区三个芦苇样点土壤中δ13C值和δ15N值无显著差异,但与恢复区芦苇土壤存在显著差异;恢复区和潮汐区湿地区域水文连通度分别为0.0520和0.0484,不同样点间水文连通度差异较大;湿地水文连通度与植物地上部分及水体悬浮颗粒物中δ13C值呈显著负相关关系,说明水文连通对水体悬浮颗粒物的来源及植物的碳代谢和生长可能存在影响。
郭雨桐 , 崔圆 , 王晨 , 王倩 , 修玉娇 , 肖蓉 , 张明祥 . 湿地要素中碳氮同位素特征与水文连通的关系[J]. 自然资源学报, 2019 , 34(12) : 2554 -2568 . DOI: 10.31497/zrzyxb.20191206
To explore the relationship between hydrological connectivity of wetlands and the characteristics of stable carbon and nitrogen isotopes in wetland components (plant, soil and water), hydrological connectivity of typical sites and stable carbon and nitrogen isotopes of plant, soil and water suspended particulate (TSS) samples from the Yellow River Delta were analyzed by field investigation and laboratory analysis. There were significant differences of δ13C between the aboveground and underground parts of the studied three plants (Phragmite australis, Typha orientalis and Suaeda salsa) in restored wetlands. The δ13C in TSS of restored wetlands was lower than that in tidal wetlands. The hydrological connectivity degree of restored wetlands and tidal wetlands was 0.0520 and 0.0484, respectively. The hydrological connectivity degree among sites was quite different. There was a significant negative correlation between the hydrological connectivity degree and the content of δ13C in TSS and aboveground part of plants, which indicated the probable effect of hydrological connectivity on the source of suspended particulate matter in water bodies, as well as the carbon metabolism in plant and plant growth.
Fig. 1 The sketch map of study area and distribution of sampling sites图1 研究区示意图及采样地分布 |
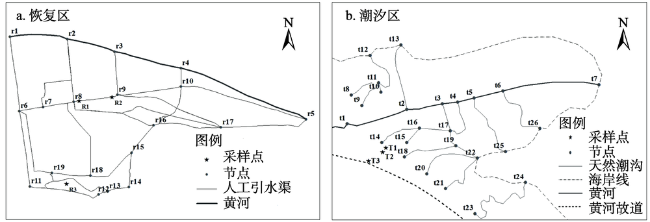
Fig. 2 Schematic diagram of river channel network in restored wetland and tidal wetland图2 研究地恢复区和潮汐区河网示意 |
Table 1 Hydraulic resistance parameters of the study area表1 研究区水流阻力参数 |
| 河道类型 | 底宽/m | 水深/m | 曼宁糙率 | 边坡系数 |
|---|---|---|---|---|
| 黄河 | 468.08 | 2.5 | 0.0275 | 1∶3 |
| 人工引水渠 | 4.64 | 0.94 | 0.0225 | 1∶3 |
| 天然潮沟 | 7.59 | 0.58 | 0.0200 | 1∶2 |
Fig. 3 Stable carbon and nitrogen isotope ratio of plants, TSS and soil from different sampling sites图3 各样点植物、水体悬浮颗粒物及土壤中碳和氮稳定同位素比值 |
Fig. 4 Soil stable carbon and nitrogen isotope ratio of sampling sites at different depths图4 黄河口湿地各样点不同深度土壤中碳氮稳定同位素比值分布 |
Table 2 The hydrological connectivity of sampling sites in the study area表2 研究区各样点水文连通度 |
| 样点 | 距离水体距离/m | 无量纲化 | 水文连通度 |
|---|---|---|---|
| R1 | 11.44 | 93.16 | 4.84 |
| R2 | 21.18 | 50.32 | 2.62 |
| R3 | 81.00 | 13.16 | 0.61 |
| T1 | 19.51 | 54.63 | 2.65 |
| T2 | 47.21 | 22.58 | 1.09 |
| T3 | 25.99 | 41.01 | 1.99 |
Table 3 Soil physicochemical properties of sampling sites表3 各样点土壤理化性质 |
| 样点 | pH | 电导率/(mS·cm-1) | 含水率/% | TOC/(mg·g-1) | TN/(mg·g-1) | C/N |
|---|---|---|---|---|---|---|
| R1 | 7.91 | 0.46 | 47.88 | 2.36 | 0.22 | 46.73 |
| R2 | 7.97 | 0.61 | 29.84 | 4.96 | 0.59 | 33.72 |
| R3 | 8.14 | 1.45 | 18.30 | 1.94 | 0.67 | 13.91 |
| T1 | 8.10 | 4.20 | 19.57 | 2.96 | 0.36 | 37.51 |
| T2 | 7.95 | 4.37 | 31.74 | 2.18 | 0.61 | 19.17 |
| T3 | 7.86 | 4.49 | 24.59 | 1.08 | 0.42 | 18.71 |
Table 4 Correlations among contents of carbon and nitrogen stable isotopes in soils, plants and TSS, hydrological connectivity and soil physicochemical properties表4 土壤、植物和水体悬浮颗粒物中碳氮稳定同位素含量与水文连通度及土壤理化性质的关系 |
| 水文连 通度 | pH | 电导率 | 含水率 | TOC | TN | C/N | TSS δ13C值 | 植物地上 δ13C值 | 植物地下 δ13C值 | 土壤 δ13C值 | TSS δ15N值 | 植物地上 δ15N值 | 植物地下 δ15N值 | 土壤 δ15N值 | |
|---|---|---|---|---|---|---|---|---|---|---|---|---|---|---|---|
| 水文连通度 | 1 | ||||||||||||||
| pH | -0.41 | 1 | |||||||||||||
| 电导率 | -0.41 | -0.07 | 1 | ||||||||||||
| 含水率 | 0.82* | -0.55 | -0.45 | 1 | |||||||||||
| TOC | 0.11 | 0.1 | -0.28 | 0.01 | 1 | ||||||||||
| TN | -0.89** | 0.53 | 0.11 | -0.73* | 0.31 | 1 | |||||||||
| C/N | 0.95** | -0.32 | -0.52 | 0.82* | 0.37 | -0.72 | 1 | ||||||||
| TSS δ13C值 | -0.95** | 0.15 | 0.52 | -0.67 | -0.31 | 0.81 | -0.9* | 1 | |||||||
| 植物地上δ13C含量 | -0.85* | -0.01 | 0.73 | -0.67 | 0.07 | 0.65 | -0.68 | 0.84* | 1 | ||||||
| 植物地下δ13C含量 | -0.5 | -0.29 | 0.59 | -0.50 | 0.07 | 0.45 | -0.43 | 0.63 | 0.92* | 1 | |||||
| 土壤δ13C值 | -0.35 | -0.39 | -0.26 | 0.10 | -0.31 | 0.28 | -0.35 | 0.47 | 0.08 | 0.11 | 1 | ||||
| TSS δ15N值 | -0.13 | -0.6 | 0.13 | 0.33 | 0.23 | 0.16 | -0.01 | 0.41 | 0.41 | 0.48 | 0.57 | 1 | |||
| 植物地上δ15N含量 | 0.07 | -0.01 | 0.03 | 0.22 | -0.85* | -0.4 | -0.17 | -0.07 | -0.43 | -0.58 | 0.30 | -0.21 | 1 | ||
| 植物地下δ15N含量 | 0.36 | -0.08 | -0.53 | 0.38 | -0.62 | -0.46 | 0.21 | -0.48 | -0.84* | -0.88* | 0.19 | -0.47 | 0.8 | 1 | |
| 土壤δ15N值 | 0.38 | -0.63 | -0.35 | 0.74 | -0.47 | -0.5 | 0.28 | -0.22 | -0.5 | -0.42 | 0.64 | 0.41 | 0.64 | 0.58 | 1 |
注:*、**分别表示在0.01、0.05水平上显著。 |
Fig. 5 Correlation between hydrological connectivity and δ13C and δ15N in TSS and plants图5 水文连通与水体、植被中δ13C和δ15N值的相关关系 |
Table 5 Distribution of carbon and nitrogen isotopes in parts of China (‰)表5 中国部分地区碳氮同位素含量分布 |
| C3植物 | 土壤(沉积物) | ||||
|---|---|---|---|---|---|
| δ13C | δ15N | δ13C | δ15N | ||
| 长江口潮滩[32] | -30.0~24.3 | 1.6~8.3 | -24.9~22.4 | 2.0~5.2 | |
| 鄱阳湖[36,37] | -33.13~27.85 | — | -28.35~18.58 | 3.27~6.84 | |
| 青藏高原[30,38-39] | -28.76~23.81 | -3.46~11.16 | -26.46~24.60 | 4.43~7.05 | |
| 太湖流域[31,40] | -24.58~20.07 | 7.29~16.59 | -19.3~24.5 | 4.5~15.2 | |
| 东江流域[20] | -29.67~24.56 | 0.67~7.67 | -27.26~24.03 | 4.31~7.03 | |
| 黄河三角洲 | -30.73~23.13 | 3.48~10.09 | -30.66~7.65 | 1.30~16.93 | |
Table 6 Correlation between hydrological connectivity and topographic factors and vegetation表6 水文连通度与地形因子、植被的相关关系 |
| 水文连通度 | 高程 | 坡度 | 地形起伏度 | 地面粗糙度 | 地形湿度指数 | NDVI | EVI | |
|---|---|---|---|---|---|---|---|---|
| 水文连通度 | 1 | |||||||
| 高程 | -0.15 | 1 | ||||||
| 坡度 | -0.28 | 0.00 | 1 | |||||
| 地形起伏度 | -0.35 | 0.11 | 0.88** | 1 | ||||
| 地面粗糙度 | -0.24 | 0.11 | 0.88** | 0.80** | 1 | |||
| 地形湿度指数 | 0.40 | -0.44* | -0.45* | -0.46* | -0.44* | 1 | ||
| NDVI | 0.15 | 0.49* | -0.26 | -0.29 | -0.24 | -0.17 | 1 | |
| EVI | 0.10 | 0.53** | -0.20 | -0.25 | -0.19 | -0.23 | 0.99** | 1 |
| [1] |
|
| [2] |
[
|
| [3] |
[
|
| [4] |
[
|
| [5] |
[
|
| [6] |
[
|
| [7] |
|
| [8] |
|
| [9] |
|
| [10] |
[
|
| [11] |
[
|
| [12] |
|
| [13] |
|
| [14] |
|
| [15] |
|
| [16] |
|
| [17] |
[
|
| [18] |
[
|
| [19] |
[
|
| [20] |
[
|
| [21] |
[
|
| [22] |
[
|
| [23] |
[
|
| [24] |
|
| [25] |
[
|
| [26] |
[
|
| [27] |
[
|
| [28] |
|
| [29] |
[
|
| [30] |
[
|
| [31] |
[
|
| [32] |
[
|
| [33] |
[
|
| [34] |
[
|
| [35] |
|
| [36] |
[
|
| [37] |
[
|
| [38] |
[
|
| [39] |
[
|
| [40] |
[
|
| [41] |
|
| [42] |
|
| [43] |
|
| [44] |
[
|
| [45] |
[
|
| [46] |
|
| [47] |
|
| [48] |
|
| [49] |
[
|
| [50] |
[
|
| [51] |
[
|
| [52] |
[
|
| [53] |
|
| [54] |
[
|
/
| 〈 |
|
〉 |
