
新安江上游流域径流变化特征与归因分析
作者简介:黄蓉(1997- ),女,四川成都人,硕士,主要从事水文气象研究。E-mail: 1403880031@qq.com
收稿日期: 2018-11-17
要求修回日期: 2019-05-05
网络出版日期: 2019-08-28
基金资助
南京信息工程大学地球科学野外科学考察项目(YWKC2018A09)
江苏省高等学校大学生创新创业训练计划项目
国家自然科学基金项目(41701019)
南京信息工程大学人才启动项目(2017r069)
中国科学院陆地水循环及地表过程重点实验室开放基金项目(2017A004)
Variation of streamflow and its drivers in Xin'an River Basin
Received date: 2018-11-17
Request revised date: 2019-05-05
Online published: 2019-08-28
Copyright
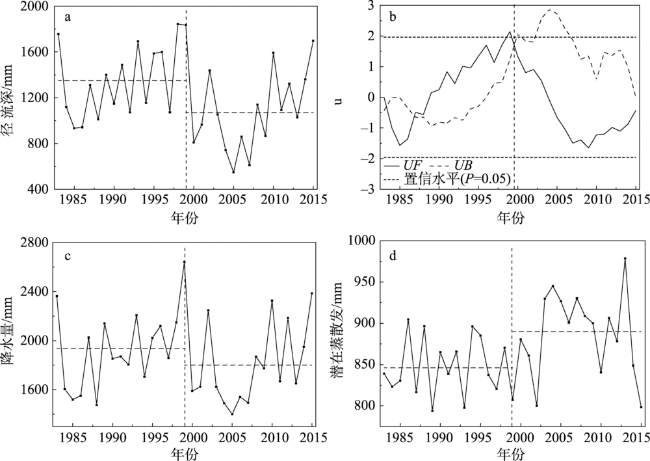
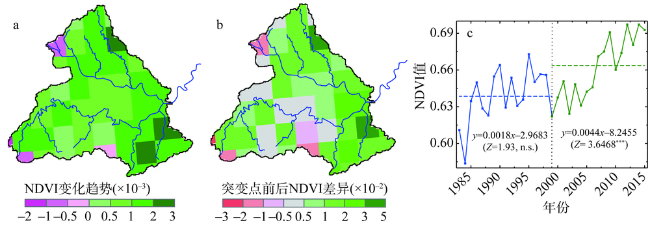
开展变化环境下新安江上游流域径流变化及其归因的研究,有助于理解湿润区水循环过程对气候变化和人类活动的响应机制。利用实测径流、气象资料和遥感植被指数(NDVI)数据,基于布迪克假设框架的弹性系数法,分析了新安江上游降水、潜在蒸散发(ET0)和植被变化对径流的影响。结果表明:(1)实测径流序列转折点发生在1999年左右。2000-2015年径流深较1983-1999年下降了281 mm,相对变化率为20.8%,且21世纪初期径流下降尤为显著。(2)2000-2015年下垫面参数n较1983-1999年增加了52.5%,植被变化对径流影响显著增强。径流对气候变化更加敏感,且对降水敏感性超过潜在蒸散发。(3)气候变化是径流变化的主导因素,其次为植被变化。气候变化和植被变化分别导致径流深下降了145.37 mm和140.96 mm,贡献率分别为50.77%和49.23%。NDVI在2000年后增加显著(P<0.001),植被变化的水文效应超过了降水和潜在蒸散发,未来长期的植被生态水文效应研究仍需进一步加强。
黄蓉 , 张建梅 , 林依雪 , 卜添荟 , 王鑫 , 薛紫月 , 李艳忠 , 马燮铫 , 于志国 , 白鹏 . 新安江上游流域径流变化特征与归因分析[J]. 自然资源学报, 2019 , 34(8) : 1771 -1781 . DOI: 10.31497/zrzyxb.20190816
Investigation to the variation of streamflow and its drivers in Xin'an River Basin under changing environment will be beneficial for understanding the geographical heterogeneity of water cycle processes in response to climate change and human activities. Using observed discharge at hydrological stations, meteorological data and remote sensing vegetation index (NDVI), the impact of precipitation, potential evapotranspiration (ET0) and vegetation change on runoff in the upper reaches of Xin'an River were analyzed. Results show that: (1) The changing point of streamflow occurred in 1999. From 2000 to 2015, the runoff depth decreased by 281 mm compared with 1983-1999, and the relative change rate was 20.8%, especially significant in the early 21st century. (2) After the changing point, the parameter n increased by 52.5%, and the influence of vegetation change on runoff was significantly enhanced. Streamflow is also more sensitive to precipitation than to ET0. (3) Climate change is the dominant factor for the decrease of runoff, followed by vegetation change. The change of climate and vegetation led to a decrease of runoff by -145.37 and 140.96 mm, respectively, with contribution rates of 50.77% and 49.23%, respectively. After 2000, The NDVI increasing trend reached a very significant level (P<0.001), and the contribution of vegetation change to runoff exceeded precipitation and ET0 individually. However, the long-term research on eco-hydrology effects of vegetation change needs to be further strengthened.
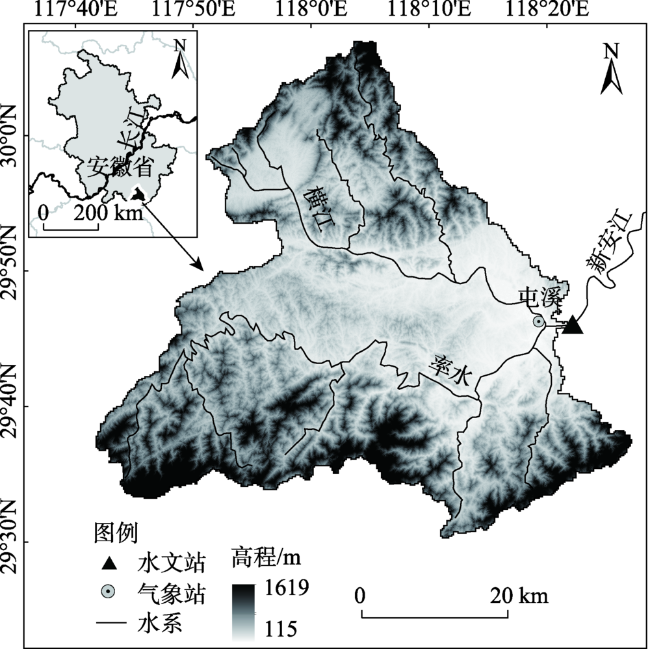
Fig. 1 Location of the study area (upper Xin'an River Basin)图1 研究区示意 |
Table 1 Detailed formulation of the partial differential items for the three factors表1 径流对三个变量的偏微分形式 |
| 偏微分项 | 公式 |
|---|---|
Fig. 2 Characteristics of streamflow, precipitation and potential evapotranspiration in Xin'an River Basin during 1983-2015图2 1983-2015年新安江上游水文气象变化特征 |
Table 2 Hydrological factors and their elasticity for the two periods表2 径流突变点前后时间段水文要素及其弹性系数 |
| 时段/年 | Q/mm | P/mm | ET0/mm | n | εP | εET0 | εn |
|---|---|---|---|---|---|---|---|
| 1983-2015 | 1215 | 1871 | 867 | 1.2 | 1.39 | -0.39 | -0.27 |
| 1983-1999 | 1351 | 1936 | 846 | 0.99 | 1.3 | -0.3 | -0.27 |
| 2000-2015 | 1070 | 1801 | 890 | 1.51 | 1.51 | -0.51 | -0.26 |
| 突变点前后变化 | -281 | -135 | 44 | 0.52 |
注:Q代表径流深,P为降水,ET0为潜在蒸散发,n为下垫面参数,、和分别代表径流对P、ET0和n的弹性。 |
Table 3 Contribution of hydrological factors to streamflow表3 径流变化的贡献率 |
| Cr_P | Cr_ET0 | Cr_n | 误差/% | |
|---|---|---|---|---|
| 贡献量/mm | -121.54 | -23.83 | -140.96 | 1.90 |
| 贡献率/% | 42.45 | 8.32 | 49.23 |
注:Cr_P、Cr_ET0和Cr_n分别表示降水、潜在蒸散发和植被对径流的贡献。 |
Fig. 3 Spatial and temporal changes in the vegetation index in upper Xin'an River Basin during 1983-2015图3 1983-2015年新安江上游生长季植被指数变化情况。 |
Table 4 Change of vegetation index and landscape parameter n in upper Xin'an River Basin during 2000-2015表4 2000-2015年新安江上游各时段植被指数与下垫面参数n变化 |
| 时段/年 | NDVI | n |
|---|---|---|
| 2000-2005 | 0.64 | 1.62 |
| 2006-2010 | 0.67 | 1.87 |
| 2011-2015 | 0.69 | 1.18 |
| [1] |
|
| [2] |
|
| [3] |
|
| [4] |
[
|
| [5] |
|
| [6] |
|
| [7] |
[
|
| [8] |
|
| [9] |
|
| [10] |
|
| [11] |
|
| [12] |
|
| [13] |
|
| [14] |
|
| [15] |
|
| [16] |
|
| [17] |
|
| [18] |
|
| [19] |
|
| [20] |
|
| [21] |
[
|
| [22] |
[
|
| [23] |
[
|
| [24] |
[
|
| [25] |
IPCC. Summary for Policymakes: The Physical Science Basis, Contribution of Working Group I to the IPCC Fifth Assessment Report Climate Change. 2013.
|
| [26] |
中国气象局气候变化中心. 中国气候变化蓝皮书. 2018.
[Center on Climate Change, China Meteorological Administration. China Blue Book on Climate Change. 2018.]
|
| [27] |
[
|
| [28] |
[
|
| [29] |
[
|
| [30] |
|
| [31] |
|
| [32] |
|
| [33] |
|
| [34] |
|
| [35] |
[
|
| [36] |
|
| [37] |
[
|
| [38] |
|
| [39] |
[
|
| [40] |
|
| [41] |
|
| [42] |
|
| [43] |
[
|
| [44] |
[
|
| [45] |
|
| [46] |
|
| [47] |
[
|
/
| 〈 |
|
〉 |