
黄河流域水资源承载力评价
作者简介:张宁宁(1994- ),女,陕西延安人,硕士,研究方向为水资源承载力研究。E-mail: 1062153157@qq.com
收稿日期: 2019-01-07
要求修回日期: 2019-05-19
网络出版日期: 2019-08-28
基金资助
“十三五”国家重点研发计划(2016YFC0401306)
Water resources carrying capacity evaluation of the Yellow River Basin based on EFAST weight algorithm
Received date: 2019-01-07
Request revised date: 2019-05-19
Online published: 2019-08-28
Copyright
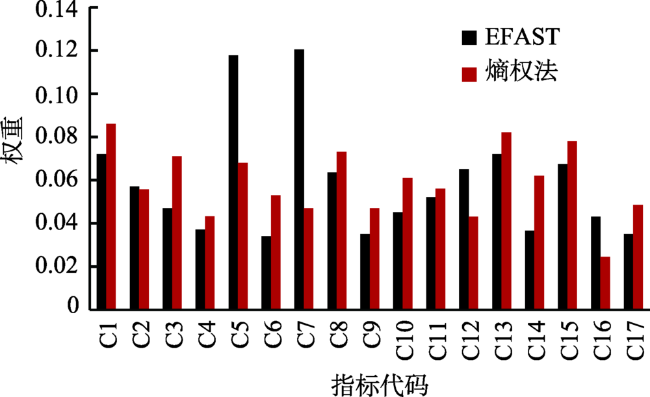
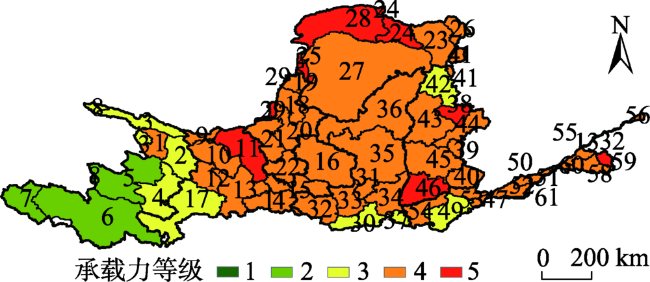
定量评价水资源承载力,可为有效调控水资源,提高水资源承载力和消除水资源超载区提供依据。从水资源承载力新内涵出发,构建“量—质—域—流”的四维水资源承载力评价指标体系,确定指标评价等级标准。针对水资源承载力评价涉及许多不确定因素以及指标间存在耦合关系等特点,采用可考虑指标间耦合关系的EFAST算法计算权重,结合可处理评价不确定性问题的联系熵模型进行水资源承载力评价。以黄河流域为例,计算得权重与熵权法进行比较,对2015年流域61个地市的水资源承载力状况进行了综合评价。结果表明:EFAST算法计算权重比熵权法更合理;黄河流域水资源承载力处于Ⅰ级(极高)、Ⅱ级(较高)、Ⅲ级(中等)、Ⅳ级(较低)和Ⅴ级(极低)的地市数量占评价总地市数的比例分别为0、4.9%、18.1%、63.9%和13.1%,其中Ⅳ级和Ⅴ级分布在除青海省外的其他省区的地市。
张宁宁 , 粟晓玲 , 周云哲 , 牛纪苹 . 黄河流域水资源承载力评价[J]. 自然资源学报, 2019 , 34(8) : 1759 -1770 . DOI: 10.31497/zrzyxb.20190815
Quantitative evaluation of water resources carrying capacity can provide a basis for effective regulation of water resources, improvement of water resources carrying capacity and elimination of water resources overload areas. Based on the new connotation of water resources carrying capacity, an evaluation index system for water resources carrying capacity was constructed which considered four aspects of water quantity, water quality, watershed and water flow. In traditional research of water resources carrying capacity, there existed many uncertain factors and coupling relationships between indicators. In order to address this issue, this paper calculated the weights using EFAST method, which considers the coupling relationship between indicators. The connection entropy model that can overcome the uncertainty of evaluation was carried out to evaluate comprehensive water resources carrying capacity. By taking the Yellow River Basin as an example, the weights of the carrying capacity indices were calculated using EFAST method and weight entropy method respectively and made a comparison between the two methods. Finally, the water resources carrying capacity of 61 cities in this basin in 2015 was comprehensively evaluated. The results showed that: EFAST method was more reasonable than entropy weight method in identifying important indicators. Cities whose water resources carrying capacity were at grade I (very high), grade II (higher), grade III (medium), grade IV (lower) and grade V (very low) levels accounted for 0%, 4.9%, 18.1%, 63.9% and 13.1% respectively of the number of cities in the Yellow River Basin. The cities of grades IV and V were distributed in provinces except Qinghai.
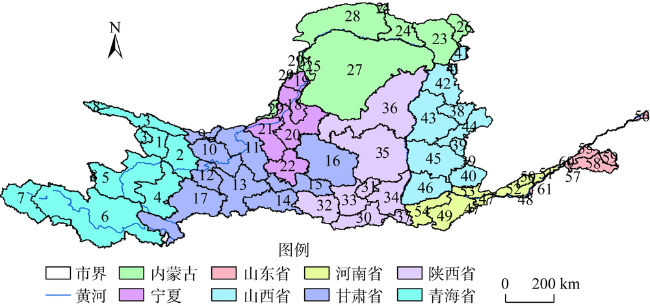
Fig. 1 Overview of the Yellow River Basin图1 黄河流域概况 |
Table1 Classification criteria and the weights for water resources carrying capacity evaluation in the Yellow River Basin表1 黄河流域各地市水资源承载力等级评价标准及权重 |
| 准则层 | 指标 代码 | 指标名称 | 权重 | Ⅰ级(极高) | Ⅱ级(较高) | Ⅲ级(中等) | Ⅳ级(较低) | Ⅴ级(极低) |
|---|---|---|---|---|---|---|---|---|
| 承载潜力大 | 可承载 | 临界超载 | 超载 | 严重超载 | ||||
| 量 | C1 | 人均水资源量/(m3/人) | 0.072 | 3000~4000 | 2000~3000 | 1000~2000 | 500~1000 | 300~500 |
| C2 | 降水深/mm | 0.057 | 800~1000 | 600~800 | 400~600 | 200~400 | 0~200 | |
| C3 | 万元农业产值用水量/(m3/万元) | 0.047 | 0~40 | 40~100 | 100~200 | 200~400 | 400~600 | |
| C4 | 人均生活用水量/(L/人·d) | 0.037 | 10~30 | 30~40 | 40~50 | 50~60 | 60~80 | |
| C5 | 地下水开采系数 | 0.118 | 0~0.5 | 0.5~0.75 | 0.75~0.9 | 0.9~1.05 | 1.05~1.3 | |
| C6 | 万元工业增加值用水量/(m3/万元) | 0.034 | 0~10 | 10~20 | 20~40 | 40~100 | 100~200 | |
| C7 | 生态环境用水率/% | 0.120 | 6~8 | 4~6 | 2~4 | 1~2 | 0~1 | |
| 质 | C8 | 水功能区水质达标率/% | 0.064 | 90~100 | 70~90 | 60~70 | 40~60 | 30~40 |
| C9 | 人均氨氮排放量/(kg/人) | 0.035 | 0~0.5 | 0.5~1 | 1~2 | 2~3 | 3~4 | |
| C10 | 人均化学需氧量排放量/(kg/人) | 0.045 | 0~2 | 2~5 | 5~10 | 10~15 | 15~20 | |
| 域 | C11 | 水域面积率/% | 0.052 | 5~8 | 3.5~5 | 2~3.5 | 1~2 | 0.5~1 |
| C12 | 湿地保留率/% | 0.065 | 90~100 | 70~90 | 50~70 | 30~50 | 20~30 | |
| C13 | 植被覆盖率/% | 0.072 | 65~75 | 55~65 | 45~55 | 30~45 | 15~30 | |
| 流 | C14 | 河网密度/(1/km) | 0.037 | 0.6~0.8 | 0.35~0.6 | 0.1~0.35 | 0.05~0.1 | 0~0.05 |
| C15 | 最小3日流量千分比/‰ | 0.067 | 3.5~5 | 3.0~3.5 | 2.5~3.0 | 1.5~2.5 | 1.0~1.5 | |
| C16 | 流量逆转次数/次 | 0.043 | 60~70 | 70~80 | 80~100 | 100~120 | 120~140 | |
| C17 | 纵向连通性/(座/103 km) | 0.035 | 0~50 | 50~100 | 100~200 | 200~300 | 300~400 |
注:C5为万元农业产值用水量,农灌用水量/农业生产总值;C11为水域面积率,直接反映水面面积,表征水域的自然生态和社会功能;C12为湿地保留率,指规划区域内2015年湿地总面积/1995年湿地总面积,表征湿地在不同人类干扰强度下的分布情况;C15为最小3日流量千分比,年最小三日径流量/多年平均径流量,满足植被扩张、河流河道地貌和自然栖息地的构建、河流和滞洪区的养分交换湖、池塘、滞洪区的植物群落分布的需要[18],表征河流流态对水生态的影响;C16为流量逆转次数,代表日流量由增加变成减少或由减少变成增加的次数,表征导致植物的干旱,促成岛上、滞洪区的有机物的诱捕、低速生物体的干燥胁迫等行为[18];C17为纵向连通性,水利工程等障碍物数量/水系长度,本文指大坝对河流连通性的影响,指标能够在一定程度上反映水坝等障碍物对生物迁移、能量及营养物质传递过程的影响。 |
Table 2 Scores and grades of water resources carrying capacity of cities in the Yellow River Basin表2 黄河流域各地市水资源承载力评分与等级 |
| 省(自治区) | 编号 | 地市 | 水量 | 水质 | 水域 | 水流 | 综合 | |||||||||
|---|---|---|---|---|---|---|---|---|---|---|---|---|---|---|---|---|
| 评分 | 等级 | 评分 | 等级 | 评分 | 等级 | 评分 | 等级 | 评分 | 等级 | |||||||
| 青海 | 1 | 西宁市 | -0.35 | 4 | -0.61 | 4 | -0.83 | 5 | 0.07 | 3 | -0.40 | 4 | ||||
| 2 | 海东市 | -0.02 | 3 | 0.51 | 2 | -0.58 | 4 | 0.15 | 3 | -0.02 | 3 | |||||
| 3 | 海北州 | 0.26 | 2 | 0.66 | 2 | -0.67 | 4 | 0.03 | 3 | 0.10 | 3 | |||||
| 4 | 黄南州 | 0.19 | 3 | 0.57 | 2 | -1.04 | 5 | 0.11 | 3 | 0.00 | 3 | |||||
| 5 | 海南州 | 0.53 | 2 | 0.73 | 2 | 0.18 | 3 | 0.07 | 3 | 0.41 | 2 | |||||
| 6 | 果洛州 | 0.71 | 2 | 0.82 | 1 | -0.59 | 4 | 0.05 | 3 | 0.36 | 2 | |||||
| 7 | 玉树州 | 0.92 | 1 | 0.72 | 2 | -0.65 | 4 | 0.18 | 3 | 0.46 | 2 | |||||
| 8 | 海西州 | 0.36 | 2 | -0.54 | 4 | -1.14 | 5 | 0.13 | 3 | -0.12 | 3 | |||||
| 甘肃 | 9 | 武威市 | -0.73 | 4 | -0.25 | 4 | -1.04 | 5 | 0.05 | 3 | -0.65 | 4 | ||||
| 10 | 兰州市 | -1.26 | 5 | 0.00 | 3 | -0.49 | 4 | -0.33 | 4 | -0.76 | 4 | |||||
| 11 | 白银市 | -1.02 | 5 | -0.56 | 4 | -0.90 | 5 | 0.06 | 3 | -0.93 | 5 | |||||
| 12 | 临夏州 | -0.79 | 4 | 0.01 | 3 | -0.46 | 4 | -0.25 | 4 | -0.52 | 4 | |||||
| 13 | 定西市 | -1.06 | 5 | 0.40 | 2 | -0.83 | 5 | -0.01 | 3 | -0.62 | 4 | |||||
| 14 | 天水市 | -0.50 | 4 | 0.32 | 2 | -0.37 | 4 | -0.30 | 4 | -0.32 | 4 | |||||
| 15 | 平凉市 | -0.23 | 4 | -0.13 | 3 | -0.77 | 4 | -0.34 | 4 | -0.34 | 4 | |||||
| 16 | 庆阳市 | -0.74 | 4 | 0.04 | 3 | -0.76 | 4 | -0.28 | 4 | -0.54 | 4 | |||||
| 17 | 甘南州 | 0.39 | 2 | 0.47 | 2 | -0.55 | 4 | 0.03 | 3 | 0.16 | 3 | |||||
| 宁夏 | 18 | 银川市 | -0.93 | 5 | -0.38 | 4 | -0.53 | 4 | -0.07 | 3 | -0.62 | 4 | ||||
| 19 | 石嘴山 | -0.80 | 5 | -0.34 | 4 | -0.33 | 4 | -0.15 | 3 | -0.53 | 4 | |||||
| 20 | 吴忠市 | -0.78 | 4 | -0.52 | 4 | -0.99 | 5 | -0.13 | 3 | -0.66 | 4 | |||||
| 21 | 中卫市 | -0.76 | 4 | -0.78 | 4 | -0.54 | 4 | -0.13 | 3 | -0.61 | 4 | |||||
| 22 | 固原市 | -0.31 | 4 | -0.97 | 5 | -0.58 | 4 | -0.32 | 4 | -0.46 | 4 | |||||
| 省(自治区) | 编号 | 地市 | 水量 | 水质 | 水域 | 水流 | 综合 | |||||||||
| 评分 | 等级 | 评分 | 等级 | 评分 | 等级 | 评分 | 等级 | 评分 | 等级 | |||||||
| 内蒙古 | 23 | 呼和浩特市 | -0.93 | 5 | -0.21 | 4 | -0.42 | 4 | -0.12 | 3 | -0.58 | 4 | ||||
| 24 | 包头市 | -1.04 | 5 | -0.57 | 4 | -0.51 | 4 | -0.08 | 3 | -0.83 | 5 | |||||
| 25 | 乌海市 | -0.81 | 5 | -0.70 | 4 | -0.39 | 4 | -0.27 | 4 | -0.62 | 4 | |||||
| 26 | 乌兰察布市 | -1.03 | 5 | -0.40 | 4 | -0.62 | 4 | -0.13 | 3 | -0.70 | 4 | |||||
| 27 | 鄂尔多斯 | -0.81 | 5 | -1.04 | 5 | 0.18 | 3 | -0.49 | 4 | -0.60 | 4 | |||||
| 28 | 巴彦淖尔 | -0.96 | 5 | -0.81 | 5 | -0.09 | 3 | -0.15 | 3 | -0.94 | 5 | |||||
| 29 | 阿拉善盟 | -1.08 | 5 | -0.53 | 4 | -1.15 | 5 | -0.87 | 5 | -0.98 | 5 | |||||
| 陕西 | 30 | 西安市 | 0.18 | 3 | -0.34 | 4 | -0.44 | 4 | -0.42 | 4 | -0.12 | 3 | ||||
| 31 | 铜川市 | -0.43 | 4 | -0.33 | 4 | -0.94 | 5 | -0.48 | 4 | -0.52 | 4 | |||||
| 32 | 宝鸡市 | -0.82 | 5 | 0.08 | 3 | -0.71 | 4 | -0.41 | 4 | -0.59 | 4 | |||||
| 33 | 咸阳市 | -1.04 | 5 | 0.07 | 3 | -0.18 | 3 | -0.51 | 4 | -0.62 | 4 | |||||
| 34 | 渭南市 | -0.82 | 5 | 0.12 | 3 | -0.31 | 4 | -0.48 | 4 | -0.53 | 4 | |||||
| 35 | 延安市 | -0.07 | 3 | 0.06 | 3 | -0.91 | 5 | -0.76 | 4 | -0.34 | 4 | |||||
| 36 | 榆林市 | -0.75 | 4 | -0.47 | 4 | -1.01 | 5 | -0.93 | 5 | -0.88 | 5 | |||||
| 37 | 商洛市 | 0.05 | 3 | 0.17 | 3 | -0.83 | 5 | -0.22 | 4 | -0.15 | 3 | |||||
| 山西 | 38 | 太原市 | -1.06 | 5 | -0.04 | 3 | -0.47 | 4 | -1.06 | 5 | -0.92 | 5 | ||||
| 39 | 长治市 | -0.76 | 4 | 0.14 | 3 | -0.54 | 4 | -0.42 | 4 | -0.53 | 4 | |||||
| 40 | 晋城市 | -0.50 | 4 | -0.12 | 3 | -0.47 | 4 | -1.10 | 5 | -0.55 | 4 | |||||
| 41 | 朔州市 | -0.52 | 4 | -0.10 | 3 | -0.43 | 4 | -0.51 | 4 | -0.44 | 4 | |||||
| 42 | 忻州市 | 0.10 | 3 | 0.07 | 3 | -0.36 | 4 | -0.44 | 4 | -0.09 | 3 | |||||
| 43 | 吕梁市 | -0.69 | 4 | -0.22 | 4 | -0.69 | 4 | -0.54 | 4 | -0.59 | 4 | |||||
| 44 | 晋中市 | -0.52 | 4 | -0.10 | 3 | -0.76 | 4 | -0.50 | 4 | -0.50 | 4 | |||||
| 45 | 临汾市 | -0.37 | 4 | -0.62 | 4 | -0.69 | 4 | -0.54 | 4 | -0.50 | 4 | |||||
| 46 | 运城市 | -1.11 | 5 | -1.08 | 5 | -0.06 | 3 | -1.20 | 5 | -1.05 | 5 | |||||
| 河南 | 47 | 郑州市 | -0.70 | 4 | -0.27 | 4 | -0.37 | 4 | -0.69 | 4 | -0.58 | 4 | ||||
| 48 | 开封市 | 0.10 | 3 | 0.03 | 3 | -0.22 | 4 | -0.25 | 4 | -0.03 | 3 | |||||
| 49 | 洛阳市 | 0.40 | 2 | 0.23 | 2 | -0.21 | 4 | -0.49 | 4 | 0.10 | 3 | |||||
| 50 | 安阳市 | 0.01 | 3 | -0.24 | 4 | -0.76 | 4 | -0.67 | 4 | -0.29 | 4 | |||||
| 51 | 濮阳市 | -0.60 | 4 | -0.98 | 5 | -0.30 | 4 | -0.46 | 4 | -0.62 | 4 | |||||
| 52 | 新乡市 | -0.48 | 4 | -0.58 | 4 | -0.28 | 4 | -0.27 | 4 | -0.42 | 4 | |||||
| 53 | 焦作市 | -0.79 | 4 | -0.65 | 4 | -0.13 | 3 | -0.43 | 4 | -0.58 | 4 | |||||
| 54 | 三门峡 | -0.02 | 3 | 0.09 | 3 | -0.37 | 4 | -1.00 | 5 | -0.31 | 4 | |||||
| 山东 | 55 | 济南市 | -0.39 | 4 | -0.20 | 4 | -0.35 | 4 | -1.15 | 5 | -0.52 | 4 | ||||
| 56 | 东营市 | -0.35 | 4 | 0.11 | 3 | 0.03 | 3 | -0.86 | 5 | -0.44 | 4 | |||||
| 57 | 济宁市 | 0.01 | 3 | -0.09 | 3 | 0.03 | 3 | -0.68 | 4 | -0.13 | 3 | |||||
| 58 | 泰安市 | -0.07 | 3 | -0.12 | 3 | -0.12 | 3 | -0.92 | 5 | -0.37 | 4 | |||||
| 59 | 莱芜市 | -1.01 | 5 | 0.34 | 2 | -0.36 | 4 | -1.11 | 5 | -0.80 | 5 | |||||
| 60 | 聊城市 | -0.41 | 4 | -0.52 | 4 | -0.31 | 4 | -1.07 | 5 | -0.53 | 4 | |||||
| 61 | 菏泽市 | -0.35 | 4 | -0.27 | 4 | -0.28 | 4 | -0.84 | 5 | -0.42 | 4 | |||||
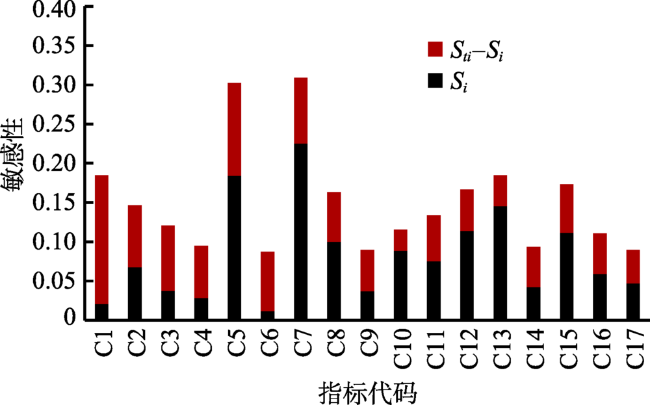
Fig. 2 Sensitivity index value of each indicator图2 各指标敏感性指数 |
Fig. 3 Weights calculated by the entropy method and the EFAST algorithm图3 EFAST算法和熵权法计算权重对比 |
Fig. 4 Gradation of water resources carrying capacity of cities in the Yellow River Basin图4 黄河流域各地市水资源承载力等级 |
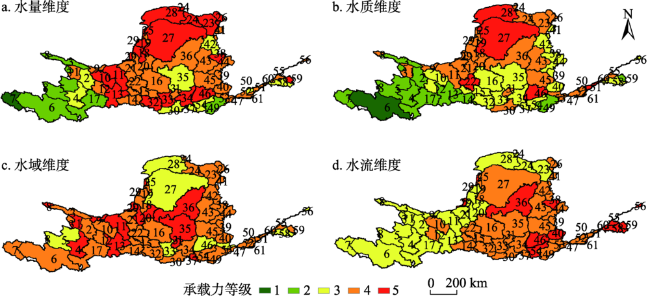
Fig.5 Gradation of "Quantity - quality - watershed- flow" water resources carrying capacity in Yellow River Basin图5 黄河流域各地市“量质域流”四维水资源承载力等级 |
| [1] |
[
|
| [2] |
[
|
| [3] |
[
|
| [4] |
[
|
| [5] |
[
|
| [6] |
[
|
| [7] |
[
|
| [8] |
[
|
| [9] |
[
|
| [10] |
[
|
| [11] |
[
|
| [12] |
|
| [13] |
[
|
| [14] |
[
|
| [15] |
[
|
| [16] |
|
| [17] |
[
|
| [18] |
[
|
| [19] |
[
|
| [20] |
[
|
| [21] |
[
|
| [22] |
[
|
/
| 〈 |
|
〉 |