
武汉城市圈湿地受损程度识别及驱动因素分析
作者简介:彭凯锋(1991- ),男,河南商丘人,博士研究生,主要从事生态变化与湿地遥感研究。E-mail: pengkaifeng@mail.bnu.edu.cn
收稿日期: 2019-03-20
要求修回日期: 2019-06-02
网络出版日期: 2019-08-28
基金资助
国家自然科学基金项目(41571077)
国家重点研发计划(2016YFC0503002)
Identification of wetland damage degree and analysis of its driving forces in Wuhan Urban Agglomeration
Received date: 2019-03-20
Request revised date: 2019-06-02
Online published: 2019-08-28
Copyright
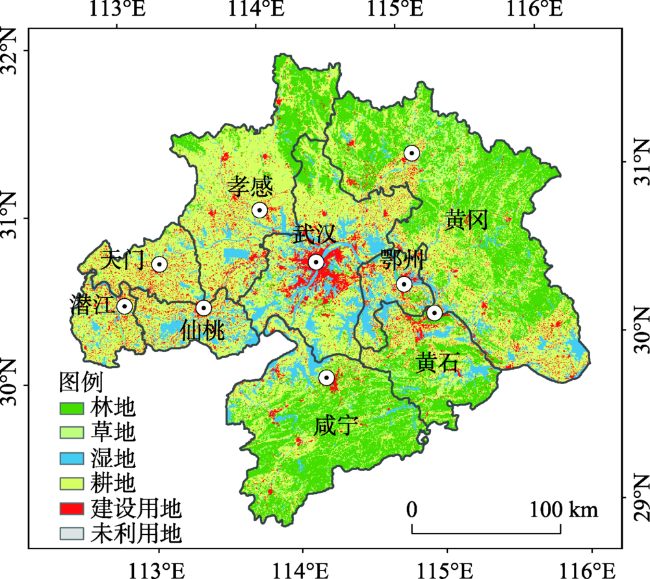
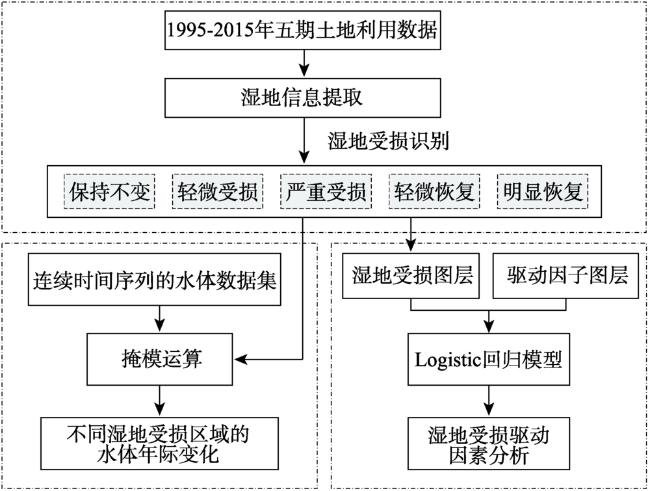
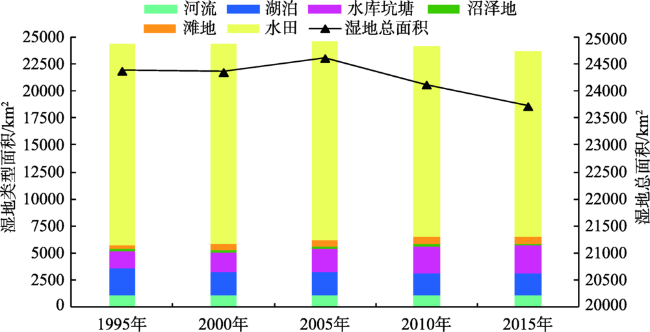
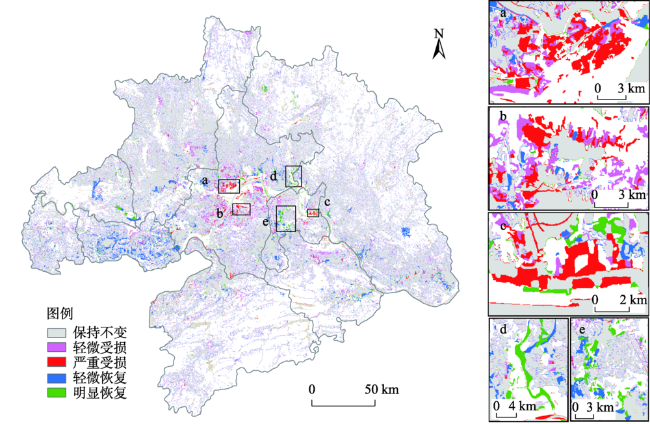
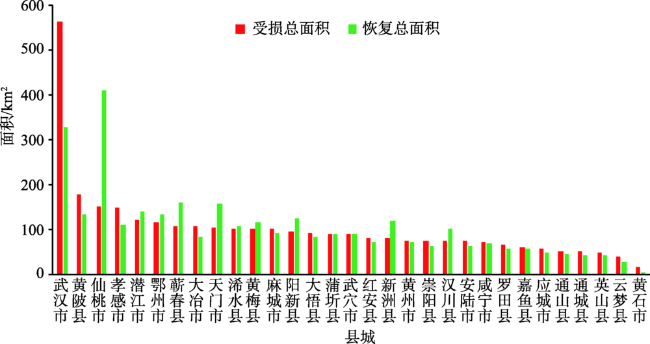
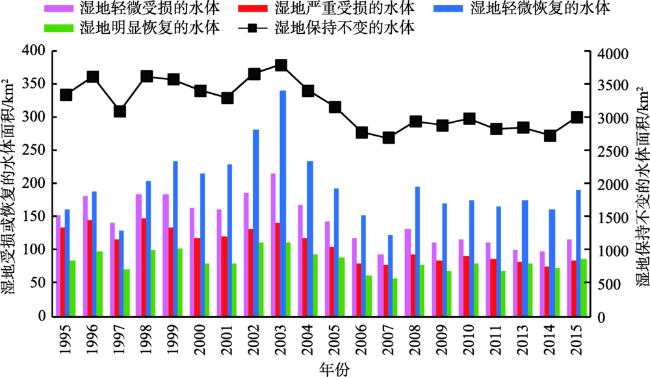
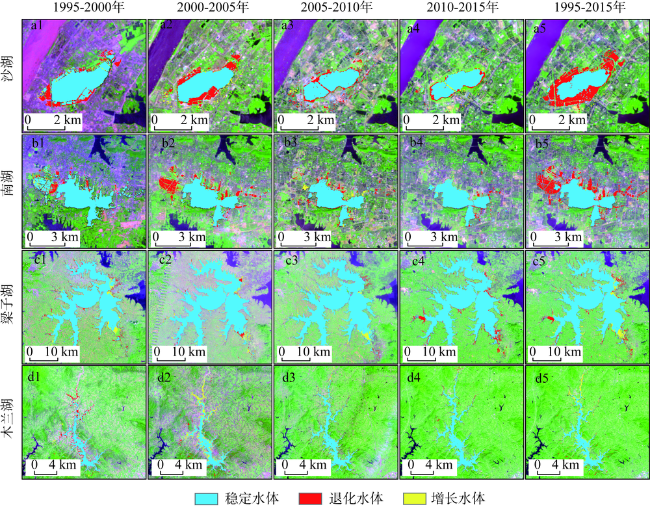
基于1995-2015年的5期土地利用数据和连续时间序列的水体数据集,探究武汉城市圈湿地受损程度及其对应的水体变化特征,并使用Logistic模型进一步揭示湿地受损的驱动机制。结果表明:(1)1995-2015年,武汉城市圈湿地面积呈先增加后减少的趋势,其面积减少了665.15 km2。湿地受损区域大多分布在武汉市、黄陂县、仙桃市等,主要是由建设用地、旱地侵占湿地引起的;湿地恢复区域大多分布在仙桃市、武汉市,主要表现为由水田向功能湿地转变。(2)20年来,湿地的变化与其水体的退化或增长变化特征相似,即湿地受损区的水体面积减少,湿地恢复区的水体面积增加。(3)Logistic回归表明,建设用地、降雨、GDP是影响湿地受损风险的主要因子,其中人类活动是湿地受损的主要因素。
彭凯锋 , 蒋卫国 , 邓越 . 武汉城市圈湿地受损程度识别及驱动因素分析[J]. 自然资源学报, 2019 , 34(8) : 1694 -1707 . DOI: 10.31497/zrzyxb.20190810
Based on the land use data of five periods during 1995-2015 and water body data of continuous time series, this paper examines the degree of wetland damage in Wuhan Urban Agglomeration and its corresponding characteristics of water body change, and then further analyzes the driving mechanism of wetland damage by logistic model. The results are as follows: (1) From 1995 to 2015, the wetland area in Wuhan Urban Agglomeration increased slightly and then decreased, and the wetland area decreased by 665.15 km2 during this period. Wetland damage areas were mainly distributed in Wuhan, Huangpi, and Xiantao, which was caused by construction land and dryland encroach wetland. Wetland restoration areas were mainly located in cities of Xiantao and Wuhan, which was caused by the transformation of paddy fields to functional wetland. (2) In the past 20 years, the characteristics of wetland change are similar to those of corresponding water decrease or increase. The area of water body in damaged wetland area decreased while that in restored wetland area increased. (3) Logistic regression result shows that construction land, precipitation and GDP are the main factors affecting the risk of wetland degradation, and human activities are the main forces influencing wetland damage.
Key words: Wuhan Urban Agglomeration; wetland damage; water body; driving forces
Fig. 1 Location of Wuhan Urban Agglomeration and the main cities图1 武汉城市圈地理位置及行政区划 |
Table 1 Driving factors of wetland damage and its data sources表1 湿地受损驱动因素及数据来源 |
| 类别 | 名称 | 单位 | 数据来源 |
|---|---|---|---|
| 气象因子 | 年平均降雨 | mm | 中国科学院资源环境科学数据中心 (http://www.resdc.cn) |
| 年平均温度 | ℃ | ||
| 地理环境因子 | DEM | m | 地理空间数据云(http://www.gscloud.cn/) |
| 坡度 | ° | ||
| 距主要公路的距离 | km | 2015年全国矢量边界数据 | |
| 距主要铁路的距离 | km | ||
| 距主要河流的距离 | km | ||
| 社会经济因子 | 建设用地 | — | 土地利用数据 |
| GDP | 103元/km2 | 中国科学院资源环境科学数据中心(http://www.resdc.cn) | |
| 人口 | 102人/km2 |
Fig. 2 Flowchart of the study图2 技术流程 |
Table 2 Types of wetland damage degree and their definition表2 湿地受损程度类型及其定义 |
| 湿地受损类型 | 定义 |
|---|---|
| 保持不变 | 功能湿地→功能湿地 |
| 水田→水田 | |
| 轻微受损 | 功能湿地→水田 |
| 水田→非湿地 | |
| 严重受损 | 功能湿地→非湿地 |
| 轻微恢复 | 非湿地→水田 |
| 水田→功能湿地 | |
| 明显恢复 | 非湿地→功能湿地 |
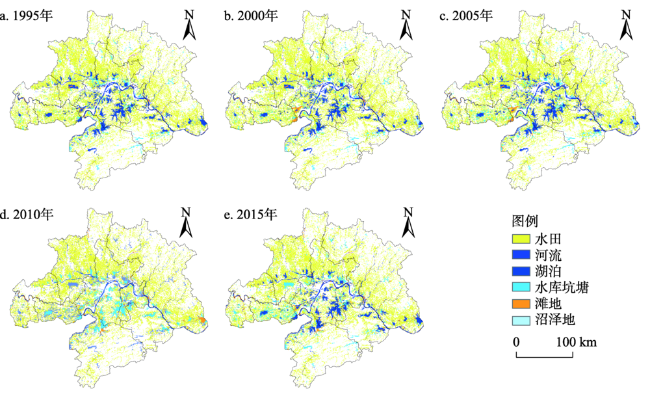
Fig. 3 The spatial distribution of wetlands in Wuhan Urban Agglomeration during 1995-2015图3 1995-2015年武汉城市圈湿地空间分布 |
Fig. 4 The area changes of various wetland types in Wuhan Urban Agglomeration during 1995-2015图4 1995-2015年武汉城市圈湿地面积变化 |
Fig. 5 Spatial distribution of wetland damage types in Wuhan Urban Agglomeration during 1995-2015图5 1995-2015年间武汉城市圈湿地受损类型空间分布 |
Table 3 The area statistics of wetland damage types in Wuhan Urban Agglomeration (km2)表3 武汉城市圈湿地受损类型面积统计 |
| 时段/年 | 轻微受损 | 严重受损 | 轻微恢复 | 明显恢复 | 保持不变 |
|---|---|---|---|---|---|
| 1995-2000 | 103.61 | 25.55 | 193.77 | 41.20 | 24069.59 |
| 2000-2005 | 264.167 | 158.19 | 661.84 | 240.20 | 23538.37 |
| 2005-2010 | 2819.97 | 465.13 | 2609.01 | 500.36 | 20530.37 |
| 2010-2015 | 431.13 | 69.02 | 100.85 | 45.80 | 23550.72 |
| 1995-2015 | 2813.38 | 384.49 | 2781.84 | 482.72 | 20130.07 |
Fig. 6 Statistics of wetland damage and restoration in county-level administrative unit during 1995-2015图6 1995-2015年间县域湿地受损与恢复面积统计 |
Fig. 7 Change in water area of different wetland damage types from 1995 to 2015图7 1995-2015年湿地受损类型的水体面积变化 |
Fig. 8 Water change map of wetland in typical area during 1995-2015图8 1995-2015年典型区域的湿地水体变化空间分布 |
Table 4 Fitting results of Logistics regression model for wetland damage in 1995-2015表4 1995-2015年间湿地受损的Logistic回归模型拟合结果 |
| 变量 | 估计量() | 标准误 | Wald | P值 | Exp() |
|---|---|---|---|---|---|
| HL=13.941,P=0.083 | |||||
| 年平均降雨量 | -0.004 | 0.000 | 75.668 | 0.000 | 0.996 |
| 年平均温度 | 0.798 | 0.289 | 7.607 | 0.006 | 2.221 |
| 坡度 | 0.045 | 0.016 | 7.705 | 0.006 | 1.046 |
| 距主要公路的距离 | -0.011 | 0.004 | 9.209 | 0.002 | 0.989 |
| 建设用地 | 6.125 | 0.241 | 645.063 | 0.000 | 457.029 |
| GDP | 0.028 | 0.004 | 43.971 | 0.000 | 1.028 |
| [1] |
|
| [2] |
[
|
| [3] |
|
| [4] |
[
|
| [5] |
|
| [6] |
|
| [7] |
[
|
| [8] |
[
|
| [9] |
|
| [10] |
|
| [11] |
[
|
| [12] |
[
|
| [13] |
[
|
| [14] |
[
|
| [15] |
[
|
| [16] |
[
|
| [17] |
[
|
| [18] |
|
| [19] |
[
|
| [20] |
[
|
| [21] |
[
|
| [22] |
|
| [23] |
[
|
| [24] |
|
| [25] |
|
| [26] |
[
|
| [27] |
[
|
/
| 〈 |
|
〉 |