
协调视角下长三角城市群的空间结构演变与优化
作者简介:范擎宇(1990- ),女,湖南衡阳人,博士研究生,研究方向为城乡发展与空间规划。E-mail: qingyufqy@126.com
收稿日期: 2019-03-26
要求修回日期: 2019-06-30
网络出版日期: 2019-08-28
基金资助
国家自然科学基金项目(41771171)
江苏省研究生科研创新计划项目(SJKY19_1126)
Evolution and optimization of spatial structure of the Yangtze River Delta Urban Agglomeration from the perspective of coordination
Received date: 2019-03-26
Request revised date: 2019-06-30
Online published: 2019-08-28
Copyright
以城市群为主体优化城镇化空间布局是构建国土空间规划体系的重要内容,空间优化的本质旨在促进城市群内部大中小城市协调发展。以长三角城市群为案例,在测度2001-2016年长三角城市群26个城市的城镇化协调水平基础上,运用社会网络和多维尺度分析等方法,分析和识别城镇化协调关系及其空间结构和内在演变机理。结果表明:(1)随着长三角城市群的城镇化协调水平提高,城市群内部的高协调城市逐渐显现出以上海为核心的“Z型”分布态势,低协调城市则稳定分布在长三角城市群扩容后的范围;(2)根据城镇化协调水平的关联强度划分长三角城市群的凝聚子群,凝聚子群的加权平均中心度和联系密度增大后,上海极化效应更加明显;(3)从城镇化协调关系的空间和时间两个维度识别城市群空间结构,长三角城市群从在空间距离影响下以省会城市为中心的“圈层”结构,变形为在时间距离影响下的“核心—边缘”结构;(4)人口、土地和经济城镇化三者协调水平的变化影响着长三角城市群空间结构演变,相较人口与经济城镇化,土地城镇化对城镇化协调关系的加强具有显著促进作用。从协调视角剖析长三角城市群的空间结构并提出优化政策,有助于中国现有资源环境承载能力条件下城市群一体化建设和空间资源的高效利用。
范擎宇 , 杨山 . 协调视角下长三角城市群的空间结构演变与优化[J]. 自然资源学报, 2019 , 34(8) : 1581 -1592 . DOI: 10.31497/zrzyxb.20190802
Taking urban agglomeration as the main object to optimize the spatial layout of urbanization is an important part of constructing the national land spatial planning system, and the essence of spatial optimization is to promote the coordinated development of large, medium and small cities within the urban agglomeration. Based on the measurement of urbanization coordination level of 26 cities in the Yangtze River Delta Urban Agglomeration from 2001 to 2016, this paper analyses and identifies the urban coordination relationship by using the methods of social network and multi-dimensional-scaling, and explores its internal evolution mechanism. The results show that: (1) With the improvement of the urbanization coordination level of the cities in the Yangtze River Delta Urban Agglomeration, the internal space of the urban agglomeration is obviously changed. The high coordination cities gradually show a Z-shaped distribution with Shanghai as the core, and the low coordination cities were stably distributed in the expanded area of the urban agglomeration. (2) According to the correlation strength of the coordination level of the Yangtze River Delta Urban Agglomeration, the cohesive subgroups were divided. The values of weighted average centrality and the contact density of the cohesive subgroups of the urbanization coordination relationship increased, and the polarization effect of Shanghai was more obvious. (3) The coordination structure of the urban agglomeration was identified from two dimensions of space and time. The Yangtze River Delta Urban Agglomeration has transformed from the "circle layer" structure centered on the provincial capital cities under the influence of spatial distance into the structure of "core-periphery" under the influence of temporal distance. (4) The evolution of spatial structure of the urban agglomeration was influenced by the change of coordination level of population, land and economy urbanization. Compared with population and economy urbanization, land urbanization has a significant role in promoting the level of urban coordination. The optimizing policies of the Yangtze River Delta Urban Agglomeration were proposed from the perspective of coordination after analyses of its spatial structure. This is conducive to the realization of the integration of urban agglomeration and the efficient use of space resources under the conditions of China's existing resource and environmental carrying capacity.
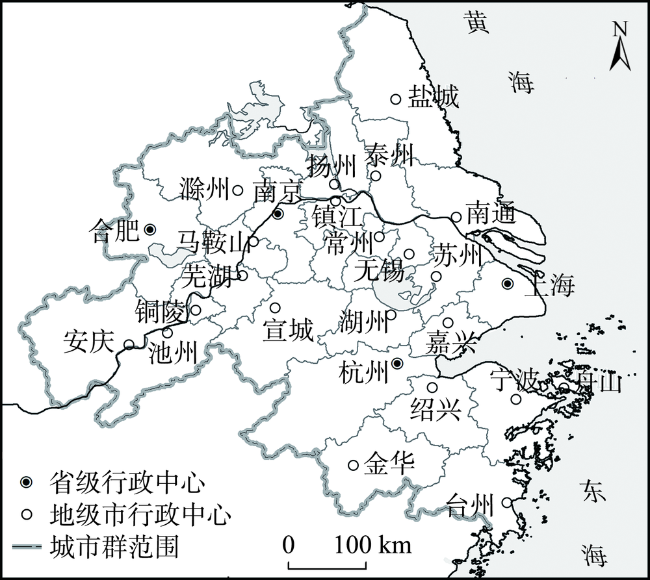
Fig. 1 The Yangtze River Delta Urban Agglomeration图1 长江三角洲城市群 |
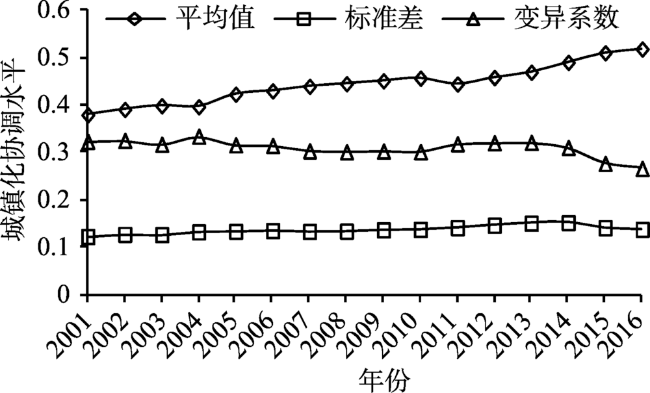
Fig. 2 Time evolution of urbanization coordination level in the Yangtze River Delta Urban Agglomeration from 2001 to 2016图2 2001-2016年长三角城镇化协调水平时间演化 |
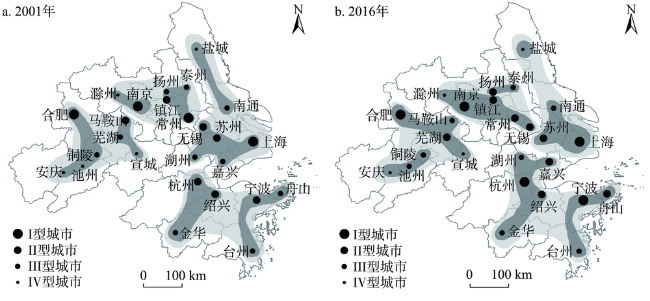
Fig. 3 Spatial evolution of urbanization coordination level in the Yangtze River Delta Urban Agglomeration from 2001 to 2016图3 2001-2016年长三角城镇化协调水平空间演化 |
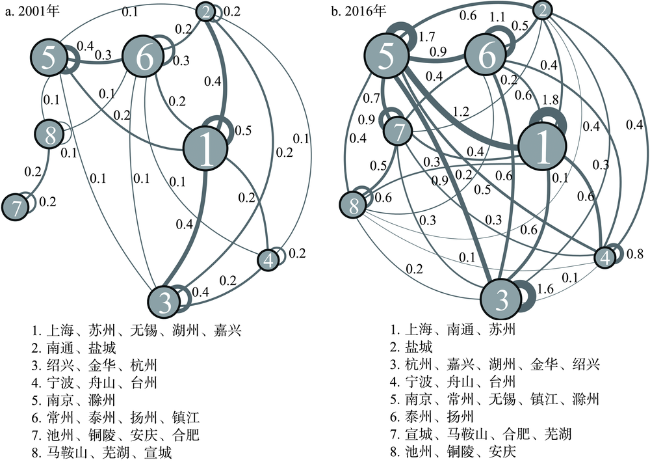
Fig. 4 Evolution of the cohesive subgroups in the coordination relationship of Yangtze River Delta Urban Agglomeration图4 长三角城市群城镇化协调关系的凝聚子群变化 |
Fig. 5 Evolution of connection strength of coordination relations of Yangtze River Delta Urban Agglomeration图5 长三角城市群协调关系凝聚子群关联强度变化 |
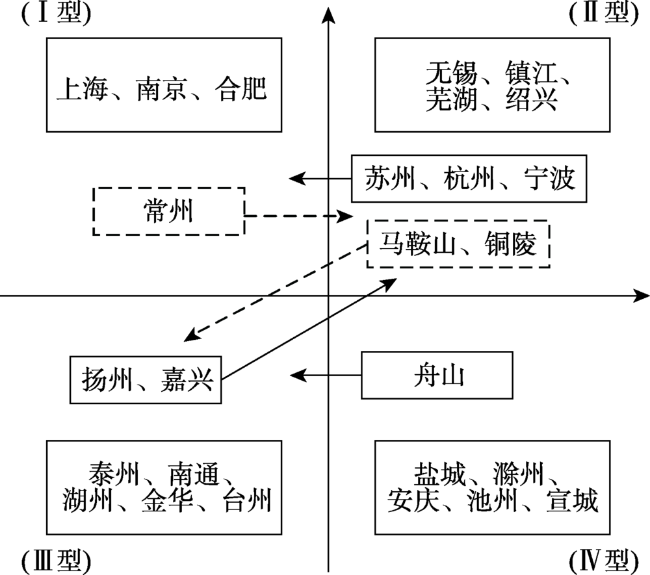
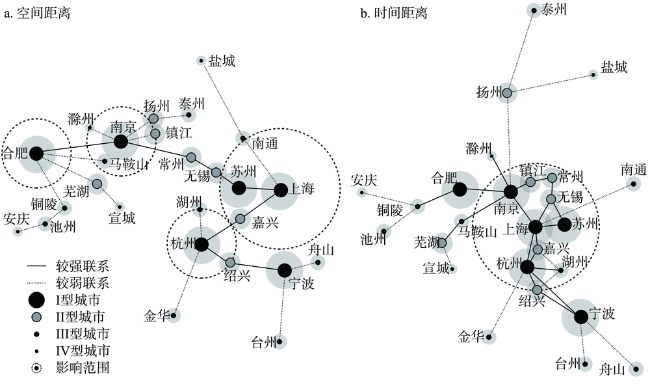
Fig. 6 Comparison of coordination structure modes of Yangtze River Delta Urban Agglomeration图6 长三角城市群城镇化协调关系的空间结构模式 |
Table 1 The regression analysis of evolution types of Yangtze River Delta Urban Agglomeration表1 长三角城市群协调水平分位数回归 |
| 分位点 | 回归系数 | C | Adj R2 | ||
|---|---|---|---|---|---|
| X1 | X2 | X3 | |||
| OLS | 0.180*** | 0.349*** | 0.356*** | 0.257*** | 0.793 |
| 0.1 | 0.362*** | 0.178*** | 0.483*** | 0.125*** | 0.564 |
| 0.2 | 0.449*** | 0.152*** | 0.344*** | 0.161*** | 0.638 |
| 0.3 | 0.437*** | 0.165*** | 0.334*** | 0.173*** | 0.674 |
| 0.4 | 0.389*** | 0.197*** | 0.352*** | 0.193*** | 0.701 |
| 0.5 | 0.376*** | 0.220*** | 0.352*** | 0.200*** | 0.719 |
| 0.6 | 0.292*** | 0.375*** | 0.373*** | 0.215*** | 0.737 |
| 0.7 | 0.259*** | 0.427*** | 0.385*** | 0.225*** | 0.772 |
| 0.8 | 0.229*** | 0.480*** | 0.360*** | 0.239*** | 0.820 |
| 0.9 | 0.231*** | 0.505*** | 0.352*** | 0.237*** | 0.874 |
注:***表示统计值在0.01水平上显著。 |
| [1] |
[
|
| [2] |
[
|
| [3] |
|
| [4] |
|
| [5] |
|
| [6] |
|
| [7] |
|
| [8] |
|
| [9] |
|
| [10] |
|
| [11] |
|
| [12] |
[
|
| [13] |
[
|
| [14] |
|
| [15] |
[
|
| [16] |
[
|
| [17] |
[
|
| [18] |
[
|
| [19] |
[
|
| [20] |
[
|
| [21] |
中华人民共和国国家发展和改革委员会. 长江三角洲城市群发展规划(2016-2020). 2016.
[National Development and Reform Commission. Yangtze River Delta urban agglomeration development plan (2016-2020). 2016.]
|
| [22] |
[
|
| [23] |
[
|
| [24] |
国家统计局城市社会经济调查司. 中国城市统计年鉴. 北京: 中国统计出版社, 2001-2016.
[Department of Urban Social and Economic Investigation, National Bureau of Statistics. China City Statistical Yearbook. Beijing: China Statistical Press, 2002-2017.]
|
| [25] |
[
|
| [26] |
[
|
| [27] |
|
| [28] |
|
| [29] |
[
|
| [30] |
[
|
| [31] |
[
|
| [32] |
[
|
| [33] |
[
|
/
| 〈 |
|
〉 |