
基于能值的哈萨克斯坦可持续发展评价
李海涛(1968- ),男,山东荣成人,博士,副研究员,硕士生导师,研究方向为能值理论与环境核算。E-mail: liht@igsnrr.ac.cn
收稿日期: 2019-11-13
要求修回日期: 2020-04-06
网络出版日期: 2020-11-27
基金资助
中国科学院A类战略性先导科技专项(XDA20010301)
Evaluation of Kazakhstan's sustainability based on emergy theory
Received date: 2019-11-13
Request revised date: 2020-04-06
Online published: 2020-11-27
Copyright
运用能值方法分析2014—2018年哈萨克斯坦的资源利用和可持续发展状况。结果表明:哈萨克斯坦的总能值使用量约有89.94%依赖于本土不可更新资源,且直接出口大量粗加工原材料(如石油、矿产、金属等)。该国能值货币比率较低(9.50×10¹¹~1.22×10¹² sej/$),单位货币所购买能值量较小;能值产出率在16.87~26.11范围内波动,从基于能值的可持续发展指数来看,2014年该指数为0.90,系统发展缺乏可持续性;2015—2018年,该指数高于1,系统发展是可持续的。此外,哈萨克斯坦环境负荷较高,主要由于对本土不可更新资源的开采及利用效率较低。对此,提出了加强可再生资源开发力度、提升资源利用效率、改善对外贸易结构等建议,以期为促进哈萨克斯坦的可持续发展提供科学依据。
李海涛 , 李明阳 . 基于能值的哈萨克斯坦可持续发展评价[J]. 自然资源学报, 2020 , 35(9) : 2218 -2228 . DOI: 10.31497/zrzyxb.20200914
Kazakhstan, an important country along the Belt and Road, is rich in non-renewable resources such as petroleum and minerals. Its economic development ranks first among the five Central Asian countries (Tajikistan, Uzbekistan, Kyrgyzstan, Turkmenistan and Kazakhstan) and has friendly trade relations with China. Therefore, understanding the economic development status and sustainable development of Kazakhstan is of great significance to bilateral friendly cooperation. We applied emergy theory to analyze the resource utilization structure, foreign trade status and sustainable development of this country in 2014-2018. The results showed that about 89.94% of Kazakhstan's total emergy used depended on the consumption of local non-renewable resources, and there was a large amount of raw materials (such as petroleum, minerals, metals, etc.) for export, which undoubtedly has a greater impact on the ecological environment and increasing environmental burden of Kazakhstan. And the export of low value-added products placed Kazakhstan in a disadvantaged position in the foreign trade market. The emergy money ratio showed that Kazakhstan's unit currency has low purchasing power (9.50×10¹¹-1.22×10¹² sej/$), and the amount of emergy purchased per unit currency is small, the country's economic development is still at a lower level than that of developed countries. The emergy yield ratio fluctuated within a range of 16.87-26.11. From the perspective of emergy-based sustainability index, the emergy yield ratio was 0.90 in 2014, the system development of Kazakhstan lacked sustainability. From 2015 to 2018, the index was higher than 1, and the system development was sustainable. In addition, Kazakhstan has a high environmental loading ratio, which is mainly due to the exploitation of local non-renewable resources, and the utilization efficiency is low. In view of the above, this paper puts forward suggestions such as strengthening the development of renewable resources, improving resource utilization efficiency, and improving the structure of foreign trade to enhance the competitiveness in the world market, in order to promote the orderly and healthy development of Kazakhstan.
Key words: emergy; sustainability; Kazakhstan
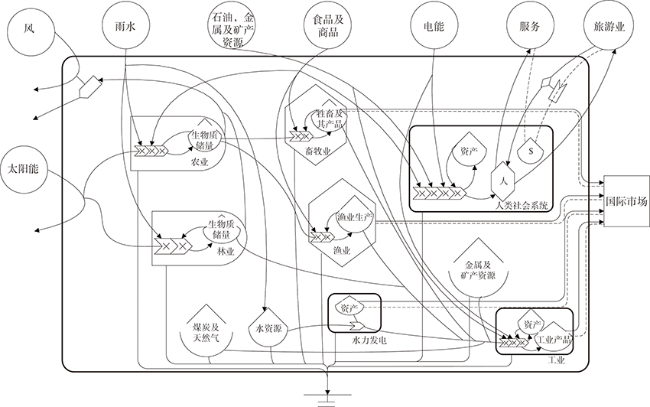
Fig. 1 The system diagram of Kazakhstan图1 哈萨克斯坦能值系统 |
Table 1 Emergy evaluation of Kazakhstan in 2014-2018表1 2014—2018年哈萨克斯坦能值分析表 |
| 序号 | 项目 | 能值转换率a | 单位 | 能值/sej | ||||
|---|---|---|---|---|---|---|---|---|
| 2014年 | 2015年 | 2016年 | 2017年 | 2018年 | ||||
| 可更新资源b: | ||||||||
| 1 2 3 4 | 太阳光 地热能 风能 水资源 | 1 4.90E+03 520 多类别c | sej/J sej/J sej/J sej/J | 1.76E+22 1.55E+22 9.00E+21 6.97E+22 | 1.76E+22 1.55E+22 9.00E+21 6.97E+22 | 1.76E+22 1.55E+22 9.00E+21 6.97E+22 | 1.76E+22 1.55E+22 9.00E+21 6.97E+22 | 1.76E+22 1.55E+22 9.00E+21 6.97E+22 |
| 自产的不可更新资源产品: | ||||||||
| 5 6 7 8 9 10 11 12 | 农业产品 畜牧业产品 渔业产品 薪材产品 工业圆木产品 水资源的提取 水力发电量 总电量 | 2.54E+05d 2.54E+06 1.01E+07 1.87E+04 1.87E+04 4.80E+04 2.54E+05 2.20E+05 | sej/J sej/J sej/J sej/J sej/J sej/J sej/J sej/J | 1.34E+23 6.59E+22 6.31E+21 2.72E+19 1.12E+19 5.18E+21 7.48E+21 8.47E+22 | 1.45E+23 6.77E+22 6.45E+21 2.72E+19 1.12E+19 5.18E+21 1.16E+22 7.25E+22 | 1.60E+23 6.97E+22 7.02E+21 2.72E+19 1.12E+19 5.18E+21 1.05E+22 7.49E+22 | 1.59E+23 7.22E+22 7.06E+21 2.72E+19 1.12E+19 5.18E+21 1.01E+22 8.16E+22 | 1.59E+23 6.38E+22 7.27E+21 2.72E+19 1.12E+19 5.18E+21 3.31E+21 8.47E+22 |
| 小计: | 3.94E+23 | 3.24E+23 | 4.11E+23 | 4.20E+23 | 4.06E+23 | |||
| 不可更新资源: | ||||||||
| 13 14 16 17 18 20 21 | 林业 渔业 表土层净损失 煤炭 天然气 矿产 金属 | 1.87E+04 1.01E+07 多类别 6.70E+04 1.40E+05 多类别 多类别 | sej/J sej/J sej/J sej/J sej/J sej/g sej/g | 4.37E+19 4.03E+20 6.70E+23 4.35E+23 2.28E+23 9.16E+21 1.22E+22 | 4.37E+19 4.03E+21 6.53E+23 4.08E+23 2.39E+23 1.54E+22 6.50E+21 | 4.37E+19 4.65E+20 6.54E+23 3.92E+23 2.45E+23 1.77E+22 8.56E+21 | 4.37E+19 5.14E+20 6.54E+23 4.39E+23 2.78E+23 1.81E+22 9.28E+21 | 4.37E+19 5.58E+20 6.55E+23 4.64E+23 2.92E+23 1.77E+22 1.05E+22 |
| 小计: | 1.36E+24 | 1.32E+24 | 1.32E+24 | 1.40E+24 | 1.44E+24 | |||
| 进口资源及产品: | ||||||||
| 22 23 24 25 26 27 28 29 30 31 32 33 | 燃料 金属 矿产 食品和农业产品 牲畜,肉类,鱼类 塑料和合成橡胶 化学品 制成品 机器和交通运输设备 其他精制品 电力 进口服务 | 多类别 多类别 多类别 多类别 多类别 多类别 多类别 多类别 多类别 2.07E+12 2.21E+05 2.07E+12 | sej/J sej/g sej/g sej/J sej/J sej/g sej/J sej/J sej/J sej/$ sej/J sej/$ | 2.20E+21 4.10E+21 2.86E+21 3.38E+21 7.41E+20 2.00E+21 3.50E+21 6.50E+21 1.61E+22 5.65E+19 9.88E+20 3.92E+22 | 1.63E+21 3.98E+21 2.27E+21 2.79E+21 5.07E+20 1.51E+21 2.92E+21 4.51E+21 1.12E+22 3.78E+19 4.99E+20 1.06E+22 | 2.25E+21 4.69E+21 3.40E+21 3.88E+21 6.90E+20 2.07E+21 3.92E+21 5.77E+21 1.31E+22 4.75E+20 1.97E+21 2.04E+22 | 2.34E+21 4.36E+21 3.49E+21 3.68E+21 7.34E+20 2.08E+21 4.17E+21 6.01E+21 1.31E+22 6.39E+19 2.04E+21 1.28E+22 | 3.18E+21 5.04E+21 4.33E+21 3.71E+21 7.32E+20 2.18E+21 4.16E+21 5.93E+21 1.50E+22 3.42E+19 1.96E+21 2.46E+22 |
| 小计: | 5.63E+22 | 4.25E+22 | 2.63E+22 | 5.49E+22 | 7.09E+22 | |||
| 出口资源及产品: | ||||||||
| 34 35 36 37 38 39 40 41 42 43 44 45 | 燃料 金属 矿产 食品和农业产品 牲畜,鱼类,肉类 塑料和合成橡胶 化学品 制成品 机器和交通运输设备 电力 出口服务 旅游业 | 多类别 多类别 多类别 多类别 多类别 多类别 多类别 多类别 多类别 2.21E+05 国家EMR 国家EMR | sej/J sej/g sej/g sej/J sej/J sej/g sej/J sej/J sej/$ sej/J sej/$ sej/$ | 5.77E+22 6.43E+21 6.07E+22 2.37E+21 1.39E+20 1.20E+20 2.90E+21 1.02E+21 1.81E+21 2.56E+21 7.55E+22 1.62E+21 | 3.03E+22 5.85E+21 3.19E+22 1.96E+21 1.20E+20 9.14E+19 3.17E+21 1.04E+21 5.95E+20 2.32E+21 6.01E+21 9.40E+20 | 3.30E+22 9.12E+21 3.54E+22 3.03E+21 1.55E+20 1.34E+20 3.77E+21 1.75E+21 1.02E+21 3.56E+21 9.00E+21 9.80E+20 | 3.90E+22 1.12E+22 4.22E+22 2.91E+21 1.60E+20 1.32E+20 3.02E+21 1.24E+21 7.95E+20 3.89E+21 8.26E+21 1.13E+21 | 5.22E+22 1.02E+22 5.55E+22 3.54E+21 2.45E+20 1.50E+20 2.96E+21 1.11E+21 7.80E+21 3.54E+21 8.87E+21 1.27E+21 |
| 小计: | 2.76E+23 | 8.43E+22 | 1.00E+23 | 1.14E+23 | 1.40E+23 | |||
注:a. 表中能值转换率的数值来源于NEAD数据库[19]。b. 可更新资源原始数据未找到,在此借鉴NEAD数据库中的数据。c. 该项目包含较多类别物质的混合,计算得出的能值为类别总能值量。d. 农业产品、畜牧业产品和总电量的能值转换率由能值基线12.0E+24 sej/a和9.44E+24 sej/a的比值计算得来。e. 出口服务、旅游业的能值转换率由能值货币比率计算得出。其中,2014年的出口服务和旅游业为1.41E+11 sej/$;2015年的出口服务和旅游业为 9.73E+11 sej/$;2016年的出口服务和旅游业为1.48E+12 sej/$;2017年的出口服务和旅游业为1.27E+12 sej/$; 2018年的出口服务和旅游业为1.22E+12 sej/$。 |
Table 2 Emergy indicators of Kazakhstan in 2014-2018表2 2014—2018年哈萨克斯坦能值指标分析表 |
| 指标 | 计算公式[13] | 计算结果 | ||||
|---|---|---|---|---|---|---|
| 2014年 | 2015年 | 2016年 | 2017年 | 2018年 | ||
| 总能值使用量U/sej | Ra+N0b+N1c+IMPd | 1.38E+24 | 1.36E+24 | 1.37E+24 | 1.43E+24 | 1.46E+24 |
| 能值使用强度指标: | ||||||
| 能值密度ED/(sej/m2) 人均能值占有量/(sej/capita) 国家能值货币比率EMR/(sej/$) | U/Area U/Population U/GDP | 5.04E+11 7.91E+15 9.50E+11 | 5.00E+11 7.71E+15 9.73E+11 | 5.03E+11 7.68E+15 1.48E+12 | 5.25E+11 7.87E+15 1.27E+12 | 5.36E+11 7.95E+15 1.22E+12 |
| 电力能值使用量比 进出口能值比 能值投入率EIR | Electricity/U IMP/EXPe IMP/(R+N0+N1) | 0.06 0.59 0.04 | 0.05 0.50 0.03 | 0.06 0.48 0.02 | 0.06 0.48 0.04 | 0.06 0.50 0.05 |
| 基于能值的可持续发展指标EmSI: | ||||||
| 环境负荷率ELR 能值产出率EYR 基于能值的可持续发展指数 | (IMP+N0+N1)/R U/IMP EYR/ELR | 18.75 16.87 0.90 | 18.57 21.10 1.15 | 18.72 22.10 1.18 | 19.55 26.11 1.34 | 19.99 20.64 1.03 |
注:a. R,可更新资源能值使用量;b. N0,粗放使用的资源;c. N1,集约使用的资源;d. IMP,进口能值量;e. EXP,出口能值量。 |
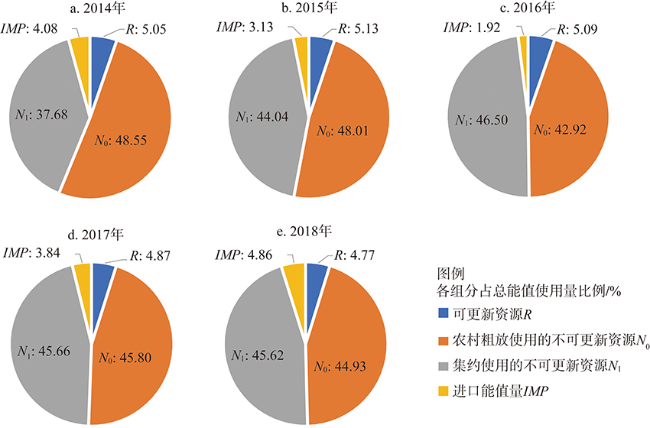
Fig. 2 Proportion of total emergy used of each component of Kazakhstan in 2014-2018图2 2014—2018年哈萨克斯坦各组分占总能值使用量比例 |
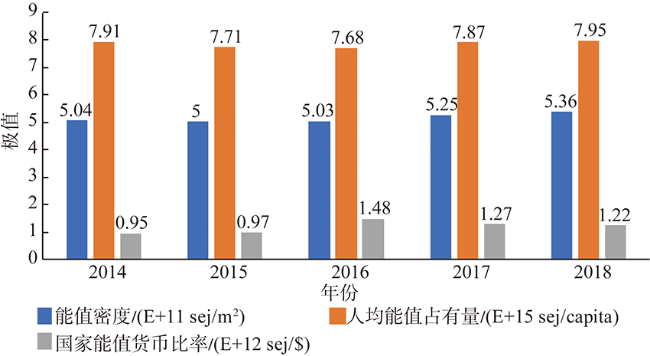
Fig. 3 Empower density, emergy use per capita and emergy monetary ratio of Kazakhstan in 2014-2018图3 2014—2018年哈萨克斯坦能值密度、人均能值占有量及能值货币比率分析 |
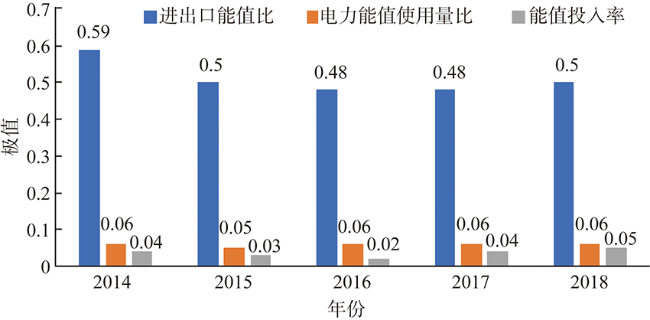
Fig. 4 Imports to exports ratio, electricity fraction and emergy investment ratio of Kazakhstan in 2014-2018图4 2014—2018年哈萨克斯坦进出口能值比、电力能值使用量比和能值投入率分析 |
Fig. 5 Emergy indices of sustainability in Kazakhstan in 2014-2018图5 2014—2018年哈萨克斯坦基于能值的可持续发展分析 |
| [1] |
|
| [2] |
[
|
| [3] |
[
|
| [4] |
|
| [5] |
[
|
| [6] |
|
| [7] |
|
| [8] |
[
|
| [9] |
[
|
| [10] |
|
| [11] |
|
| [12] |
[
|
| [13] |
Ministry of National Economy of the Republic of Kazakhstan Committee on Statistics. Kazakhstan Statistical Yearbook in 2014-2018. Astana, 2019.
|
| [14] |
[
|
| [15] |
[
|
| [16] |
|
| [17] |
|
| [18] |
|
| [19] |
[
|
| [20] |
[
|
| [21] |
[
|
| [22] |
[
|
| [23] |
国际环境核算数据库(NEAD). 哈萨克斯坦环境核算数据. http://www.cep.ees.ufl.edu/nead/, 2019-10-01.
[The National Environmental Accounting Database. NEAD data by Kazakhstan. http://www.cep.ees.ufl.edu/nead/, 2019-10-01.]
|
| [24] |
[
|
| [25] |
|
| [26] |
|
| [27] |
[
|
/
| 〈 |
|
〉 |
