
京津风沙源区防风固沙功能的时空变化及其区域差异
作者简介:张彪(1980- ),男,山东郓城人,博士,副研究员,主要从事城市与区域生态学研究。E-mail: zhangbiao@igsnrr.ac.cn
收稿日期: 2018-10-23
要求修回日期: 2019-03-12
网络出版日期: 2019-05-28
基金资助
国家重点研发计划重点专项(2016YFC0503403)
Spatial-temporal changes and regional differences of the sand-fixing service in the Beijing-Tianjin sandstorm source region
Received date: 2018-10-23
Request revised date: 2019-03-12
Online published: 2019-05-28
Copyright
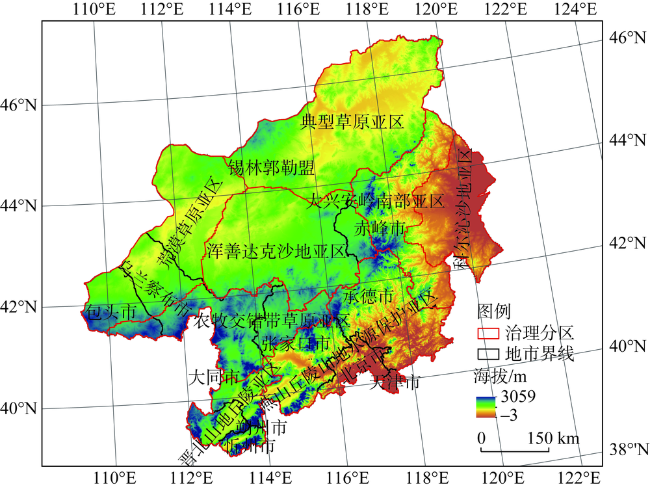
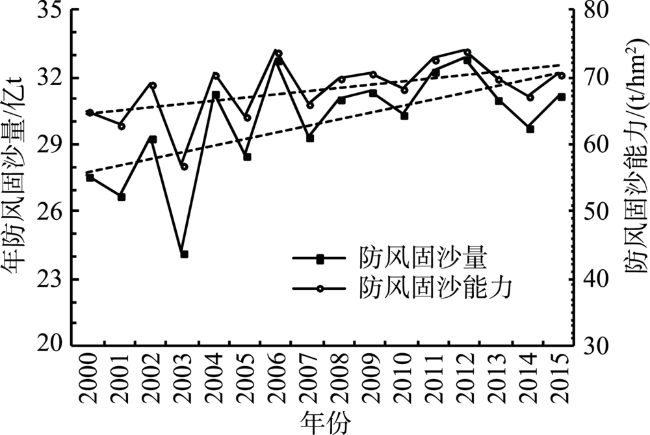
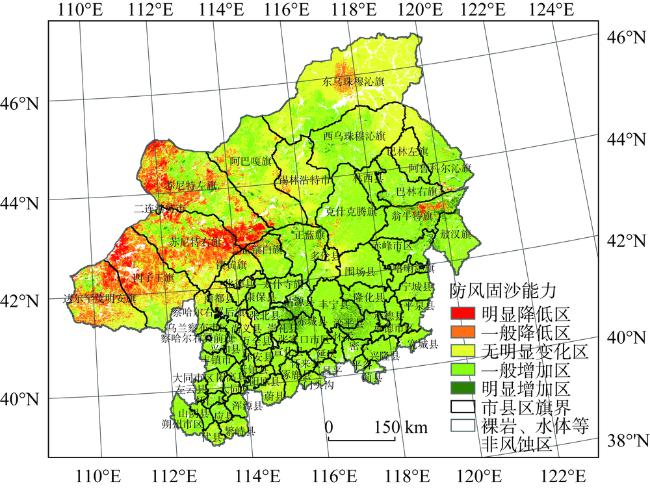
防风固沙功能是京津风沙源治理成效的关键监测指标。以往研究注重局地防风固沙功能的评估,对全区防风固沙功能的时空变化与内部差异揭示不足。基于京津风沙源区多期遥感数据,采用修正风蚀方程与GIS空间统计技术,评估分析了2000-2015年防风固沙功能的整体变化及其区域差异。结果表明:(1)京津风沙源区年均防风固沙量为28.98亿t,防风固沙能力为68.24 t/hm2,且均随年份变化波动增加,年均增速分别为1.10%和0.71%;(2)京津风沙源区防风固沙能力呈西北高、东南低趋势,有49.06%的区域防风固沙能力高于70 t/hm2,评估期内有54%的区域防风固沙能力明显提高;(3)浑善达克沙地亚区、典型草原亚区和荒漠草原亚区的防风固沙量累计为全区防风固沙总量的88%,燕山丘陵山地水源保护亚区和晋北山地丘陵亚区的防风固沙能力提升最显著;(4)锡林郭勒盟、赤峰市和乌兰察布市的防风固沙量合计占全区防风固沙量的77%,朔州市与包头市防风固沙能力较高,北京市与天津市防风固沙能力增速较高。因此,未来应重视分区施策治理与西部和北部防风固沙功能提升。
张彪 , 李庆旭 , 王爽 , 谢高地 . 京津风沙源区防风固沙功能的时空变化及其区域差异[J]. 自然资源学报, 2019 , 34(5) : 1041 -1053 . DOI: 10.31497/zrzyxb.20190511
Wind erosion is an important soil degradation process that takes place in arid and semiarid environments, and the sand-fixing service has been used as one of the key indicators of the ecological restoration effects in the Beijing-Tianjin sandstorm source region. Over the past few decades, some studies have focused on the sand-fixing service at local areas in the Beijing-Tianjin sandstorm source region, but few researchers explored the entire changes and regional differences of sand-fixing service. The inadequate information on the sand-fixing service heterogeneity has hindered the implementation of the diversified measures for land management. This paper investigated the dynamic changes and regional differences of the sand-fixing service in the Beijing-Tianjin sandstorm source region from 2000 to 2015 through multi-period RS data and GIS spatial statistical technologies. The annual amount of fixed sand and average amount of fixed sand per hectare of land served as two indicators for the changes and differences of sand-fixing service. The results indicated that, the annual amount of fixed sand nearly reached 2.90 billion tons in the study region, the average capacity of sand-fixing was 68.24 t/hm2, and the two indexes annually increased by 1.10% and 0.71%, respectively. The average sand-fixing ability in the northwest of sandstorm source region has a significantly higher level than the southeast part. Approximately 49.06% of the Beijing-Tianjin sandstorm source region generated the sand-fixing capacity higher than 70 t/hm2, and nearly 54% presented an obvious increase in the sand-fixing ability from 2000 to 2015. The Hunshadake sand subzone, the typical grassland subzone and the desert grassland subzone provided 88% of the total amount of fixed sand in the sandstorm source region, whereas the sand-fixing ability in the Jinbei mountain-hill subzone and the Yanshan mountain-hill-water source protection subzone showed higher annual increase rates. In addition, the accumulated amount of fixed sand in Xilin Gol, Chifeng and Ulanqab exceeded 77% of the total amount of sand-fixing service, however, those regions with higher sand-fixing ability are mainly located in Shuozhou and Baotou, and the lands in Beijing and Tianjin showed higher increase rates in sand-fixing abilities. Therefore, we should take differential strategies in different sand-fixing service restoration zones, and pay more attention to the improvement of sand-fixing service in the western and northern parts of the Beijing-Tianjin sandstorm source region.
Fig. 1 Altitudes and zones in the Beijing-Tianjin sandstorm source region图1 京津风沙源区海拔及区域组成 |
Table 1 Statistical variables on sand-fixing service in the Beijing-Tianjin sandstorm source region from 2000 to 2015表1 2000-2015年京津风沙源区防风固沙功能变化统计 |
| 防风固沙功能 | 最大值 | 最小值 | 平均值 | 相关系数r | 显著性Sig | 年变化率/% |
|---|---|---|---|---|---|---|
| 防风固沙量/亿t | 32.84 | 24.19 | 29.98 | 0.611 | 0.012* | 1.01 |
| 防风固沙能力/(t/hm2) | 73.98 | 56.97 | 68.24 | 0.524 | 0.037* | 0.71 |
注:*为P=0.05水平下显著。 |
Fig. 2 Changes of sand-fixing service in the Beijing-Tianjin sandstorm source region图2 京津风沙源区防风固沙功能变化 |
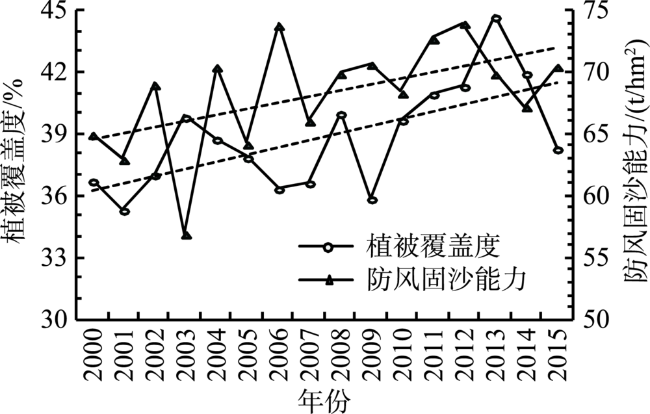
Fig. 3 Changes of vegetation coverage and sand-fixing capacity in the Beijing-Tianjin sandstorm source region图3 京津风沙源区防风固沙能力与植被覆盖变化 |
Table 2 Changes of sand-fixing capacity in the Beijing-Tianjin sandstorm source region from 2000 to 2015表2 2000-2015年京津风沙源区防风固沙能力变化 |
| 防风固沙 能力分区 | 固沙能力(SRA) 分级依据/(t/hm2) | 分区面积 比例/% | 防风固沙能力 变化分区 | 变化值(Δ)分级 依据/(t/hm2) | 变化区面积 比例/% |
|---|---|---|---|---|---|
| 高值区 | SRA≥100 | 19.64 | 明显增加区 | Δ≥30 | 2.22 |
| 较高区 | 70≤SRA<100 | 29.42 | 一般增加区 | 5≤SRA<30 | 51.52 |
| 一般区 | 40≤SRA<70 | 20.95 | 无变化区 | -5≤SRA<5 | 42.51 |
| 较低区 | 10≤SRA<40 | 19.15 | 一般降低区 | -30≤SRA<-5 | 0.97 |
| 低值区 | SRA<10 | 10.84 | 明显降低区 | SRA<-30 | 2.78 |
Fig. 4 Averaged sand-fixing capacity in the Beijing-Tianjin sandstorm source region图4 京津风沙源区多年平均防风固沙能力空间分布 |
Fig. 5 Changed areas of sand-fixing capacity in the Beijing-Tianjin sandstorm source region图5 京津风沙源区防风固沙能力变化区 |
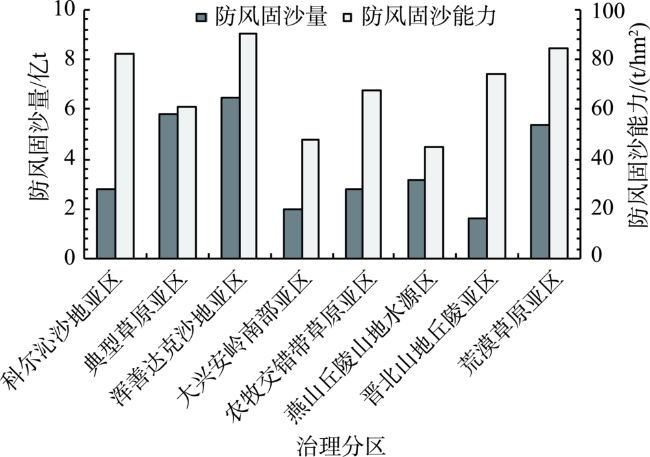
Fig. 6 Changes of sand-fixing service in eight subzones of the Beijing-Tianjin sandstorm source region图6 京津风沙源不同亚区防风固沙功能差异 |
Table 3 Statistical variables on the sand-fixing services in subzones of the Beijing-Tianjin sandstorm source region表3 京津风沙源区亚区防风固沙功能变化统计 |
| 治理分区 | 防风固沙量相关检验与拟合 | 防风固沙能力相关检验与拟合 | |||||
|---|---|---|---|---|---|---|---|
| 相关系数r | 显著性 Sig. | 防风固沙量 变化/(万t/a) | 相关系数r | 显著性 Sig. | 防风固沙能力 变化/(t/hm2) | ||
| 科尔沁沙地亚区 | 0.596 | 0.015* | 218.44 | 0.506 | 0.045* | 0.50 | |
| 典型草原亚区 | 0.368 | 0.161 | — | 0.183 | 0.498 | — | |
| 浑善达克沙地亚区 | 0.490 | 0.054 | — | 0.304 | 0.253 | — | |
| 大兴安岭南部亚区 | 0.562 | 0.023* | 210.00 | 0.534 | 0.033* | 0.45 | |
| 农牧交错带草原亚区 | 0.505 | 0.046* | 291.56 | 0.432 | 0.094 | 0.55 | |
| 燕山丘陵山地水源保护亚区 | 0.745 | 0.001** | 681.56 | 0.745 | 0.001** | 0.97 | |
| 晋北山地丘陵亚区 | 0.518 | 0.040* | 145.31 | 0.533 | 0.034* | 0.71 | |
| 荒漠草原亚区 | 0.327 | 0.217 | — | 0.121 | 0.657 | — | |
注:*、**分别为0.05、0.01水平下显著,—为非线性关系下未拟合其趋势变化,下同。 |
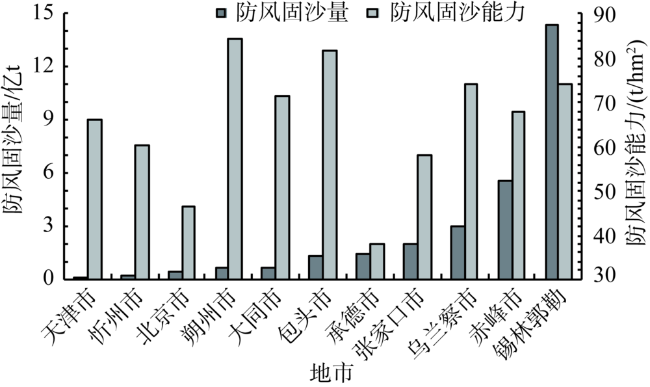
Fig. 7 Municipal differences of sand-fixing service in the Beijing-Tianjin sandstorm source region图7 京津风沙源区不同地市防风固沙功能差异 |
Table 4 Statistical variables on the sand-fixing service of cities in the Beijing-Tianjin sandstorm source region表4 京津风沙源区地市防风固沙功能变化统计 |
| 地市 | 相关系数r | 显著性 Sig. | 防风固沙 变化/(万t/a) | 相关系数r | 显著性 Sig. | 防风固沙能力 变化/(t/hm2) |
|---|---|---|---|---|---|---|
| 锡林郭勒盟 | 0.505 | 0.046* | 1095.00 | 0.306 | 0.248 | — |
| 赤峰市 | 0.582 | 0.018* | 463.13 | 0.525 | 0.037* | 0.45 |
| 包头市 | 0.146 | 0.590 | — | –0.158 | 0.559 | — |
| 承德市 | 0.722 | 0.002** | 368.44 | 0.719 | 0.002** | 0.95 |
| 张家口市 | 0.717 | 0.002** | 360.94 | 0.704 | 0.002** | 0.96 |
| 乌兰察布市 | 0.396 | 0.129 | — | 0.225 | 0.403 | — |
| 北京市 | 0.736 | 0.001** | 89.06 | 0.750 | 0.001** | 1.05 |
| 天津市 | 0.718 | 0.002** | 15.94 | 0.729 | 0.001** | 1.42 |
| 大同市 | 0.562 | 0.024* | 70.31 | 0.575 | 0.020** | 0.78 |
| 朔州市 | 0.468 | 0.068 | — | 0.480 | 0.060 | — |
| 忻州市 | 0.512 | 0.043* | 20.63 | 0.532 | 0.034* | 0.56 |
| [1] |
[
|
| [2] |
[
|
| [3] |
[
|
| [4] |
Millennium Ecosystem Assessment. Ecosystem and Human Well-Being: Synthesis. Washington, DC: Island Press, 2003.
|
| [5] |
[
|
| [6] |
[
|
| [7] |
京津风沙源治理工程二期规划思路研究项目组. 京津风沙源治理工程二期规划思路研究. 北京: 中国林业出版社, 2013.
[The Study Team of the Second Stage of the Beijing-Tianjin Sandstorm Source Control Project. The Planning Thoughts on the Second Stage of the Beijing-Tianjin Sandstorm Source Control Project.Beijing: China Forestry Publishing House, 2013.]
|
| [8] |
[
|
| [9] |
[
|
| [10] |
[
|
| [11] |
[
|
| [12] |
[
|
| [13] |
[
|
| [14] |
[
|
| [15] |
[
|
| [16] |
|
| [17] |
|
| [18] |
|
| [19] |
|
| [20] |
|
| [21] |
|
| [22] |
[
|
| [23] |
[
|
| [24] |
|
| [25] |
|
| [26] |
[
|
| [27] |
|
| [28] |
[
|
| [29] |
[
|
| [30] |
[
|
| [31] |
[
|
| [32] |
[
|
| [33] |
[
|
/
| 〈 |
|
〉 |
