
基于随机森林的耕地利用效率测度模型构建及其应用
作者简介:陈丹玲(1993- ),女,江苏徐州人,博士研究生,研究方向为土地利用与管理。E-mail: hustcdl93@163.com
收稿日期: 2018-11-12
要求修回日期: 2019-03-18
网络出版日期: 2019-06-20
基金资助
国家自然科学基金项目(71673096)
国家社会科学基金项目(16CGL054)
Measurement of cultivated land utilization efficiency: Construction and application of random forest
Received date: 2018-11-12
Request revised date: 2019-03-18
Online published: 2019-06-20
Copyright
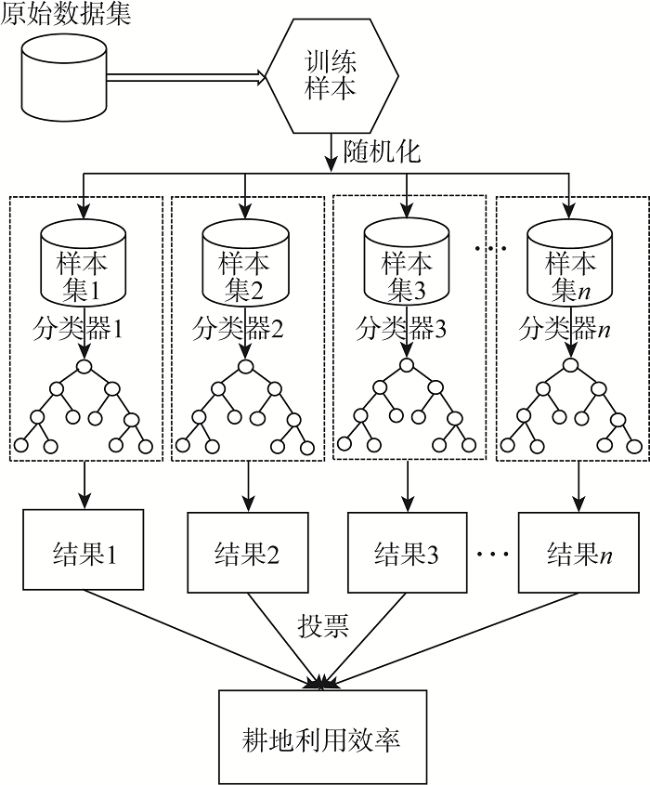
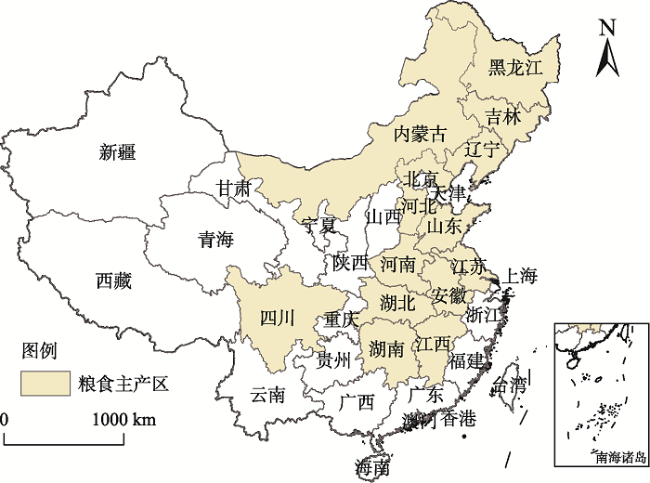
构建合适的量化分析模型是科学把握耕地利用状况及利用效率的基础性工作,可为制定合理有效的耕地资源管控政策,实现耕地利用与生态环境的协调发展提供决策依据。为了更准确地反映耕地利用系统的复杂性、动态性及差异性等特征,鉴于随机森林的基本思想,运用随机抽样Bootstrap法在合理构建分类树的基础上,构造了耕地利用效率测度的RF模型,进而以中国粮食主产区172个城市为例训练该模型并将其运用至2003-2015年的耕地利用效率测度中,同时将BP神经网络和熵权法作为对比验证其一致性、代表性和优越性。结果表明:(1)耕地利用效率测度的RF模型不受量纲限制,运行所需参数少,运算过程简化,能够较为精确地模拟各评价指标间的复杂联系,科学量化各评价指标对耕地利用效率的贡献。(2)对同一空间单元的效率值而言,RF>BPNN>EW,RF与BPNN所得效率值的总体分布格局相似,且均与EW的测度结果存在较大差异。(3)从评价结果与现实的匹配度和精度表征参数来看,RF的测度结果与自然和社会经济发展等客观事实更相符,具有较高的适用性与可靠性。同时,与其余两种常用模型相比,RF能够降低计算复杂度,提高训练效率,其测度结果的相关系数R为0.8685,MRPD为2.3533,且具有最小MMSE0.0174和MMAE0.0211,更适用于复杂非线性特征的耕地利用效率研究。
陈丹玲 , 卢新海 , 匡兵 . 基于随机森林的耕地利用效率测度模型构建及其应用[J]. 自然资源学报, 2019 , 34(6) : 1345 -1356 . DOI: 10.31497/zrzyxb.20190617
Setting up a suitable quantitative analysis model is a basic work for scientific grasp of cultivated land utilization efficiency and its distribution pattern, and can provide reasonable decision-making basis for sustainable utilization of cultivated land then realizing the coordinated development of cultivated resources and environment. In order to effectively describe the complexity, dynamics and heterogeneity characteristics of cultivated land use system, a random forest (RF) model for measuring cultivated land utilization efficiency is constructed by applying random sampling Bootstrap to build a classification tree reasonably. Then by taking 172 cities in the major grain producing areas of China as an example, the RF model was trained to measure the cultivated land utilization efficiency in 2003-2015 compared with Back Propagation Neural Network and Entropy weight to verify the consistency, representative and superiority of RF. The results show that: (1) RF model has fewer parameters and simpler implementation. It can simulate the complex relations among the evaluation indexes, which makes it convenient to analyze the value of each index. (2) For efficiency measurement results of the same space unit, RF > BPNN > EW, the overall distribution pattern of the cultivated land utilization efficiency in RF and BPNN is similar while a great difference exists in EW. (3) Judged from the matching degree of evaluation results to reality and the accuracy parameters, the measurement results are reasonable and in accordance with the facts in RF, which reflected its high applicability and reliability. At the same time, compared with the other two commonly used models, RF can reduce the dimensions of input vectors and the computing complexity, then raise the training efficiency. The correlation coefficient R of RF is 0.8685, MRPD is 2.3533, with the minimum MMSE and MMAE being 0.0174 and 0.0211, respectively, which is more suitable for the study of the cultivated land utilization efficiency with complex nonlinear characteristics, and this method has explored a new way for evaluating cultivated land utilization efficiency.
Fig. 1 The basic principle of RF图1 RF的基本思路 |
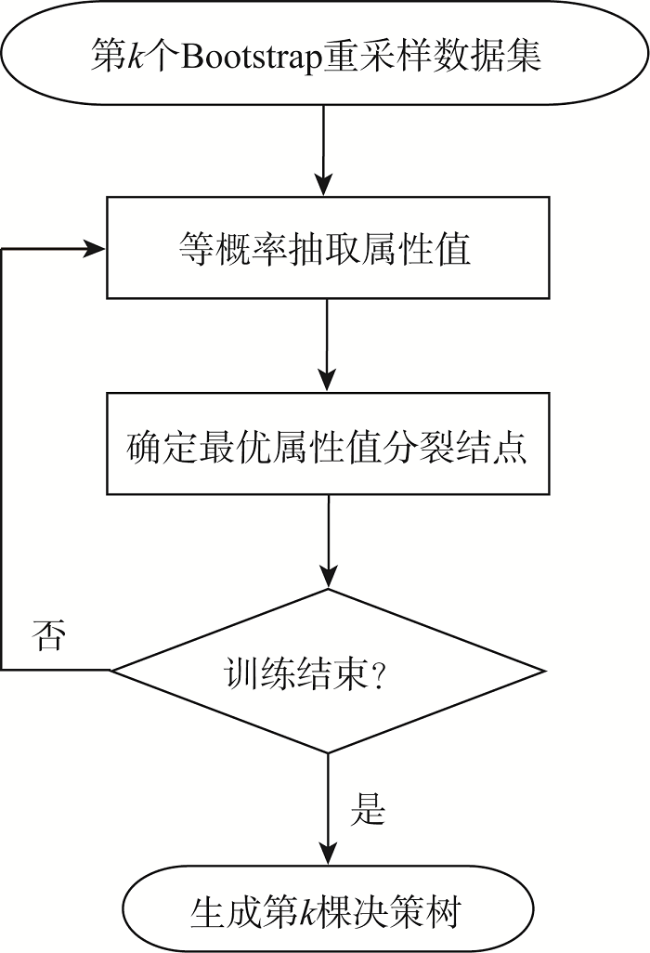
Fig. 2 Construction of decision trees图2 分类树构建 |
Fig. 3 Location of the major grain producing areas in China图3 中国粮食主产区分布图 |
Table 1 Index system for cultivated land utilization efficiency表1 耕地利用效率测度指标体系 |
| 准则层 | 指标层 | 计算依据 | 说明 |
|---|---|---|---|
| 投入水平 | 地均农业机械投入/(kW·hm-2) | 农业机械总动力/耕地面积 | 保留 |
| 地均科技投入/(104元·hm-2) | 技术投入总额/耕地面积 | 删除 | |
| 地均劳动力投入/(人·hm-2) | 农业从业人数/耕地面积 | 保留 | |
| 地均化肥投入/(kg·hm-2) | 化肥施用量/耕地面积 | 保留 | |
| 利用强度 | 垦殖指数/% | 耕地面积/土地总面积[9] | 删除 |
| 灌溉指数/% | 耕地有效灌溉率 | 保留 | |
| 复种指数/% | 农作物播种总面积/耕地面积[5] | 保留 | |
| 稳产指数/% | 旱涝收保面积/耕地面积[9] | 保留 | |
| 农膜利用强度/(kg·hm-2) | 农膜使用量/耕地面积 | 删除 | |
| 产出效益 | 粮食单产/(104 kg·hm-2) | 粮食总产量/耕地面积 | 保留 |
| 农民人均农业产值/(104元·人-1) | 农业产值/农业人口数 | 保留 | |
| 单位面积农业产值/(104元·hm-2) | 农业产值/耕地面积 | 保留 | |
| 万元产值能耗/(kwh·元-1) | 农业用电量/农业总产值 | 删除 | |
| 可持续性 | 人均耕地面积/(hm2·人-1) | 耕地面积/总人口 | 保留 |
| 非农指数/% | 非农业人口总数/总人口 | 删除 | |
| 粮食安全系数/(kg·人-1) | 人均粮食占有量/400 kg | 保留 | |
| 农业自然灾害成灾率/% | — | 保留 | |
| 森林覆盖率/% | — | 删除 |
Table 2 Errors corresponding to different m values表2 不同m取值的对应误差 |
| 个数 | 1 | 2 | 3 | 4 | 5 | 6 | 7 | 8 | 9 | 10 | 11 | 12 |
|---|---|---|---|---|---|---|---|---|---|---|---|---|
| 误差值 | 0.3617 | 0.3299 | 0.2677 | 0.2173 | 0.2011 | 0.1944 | 0.1802 | 0.1814 | 0.1819 | 0.1817 | 0.1822 | 0.1830 |
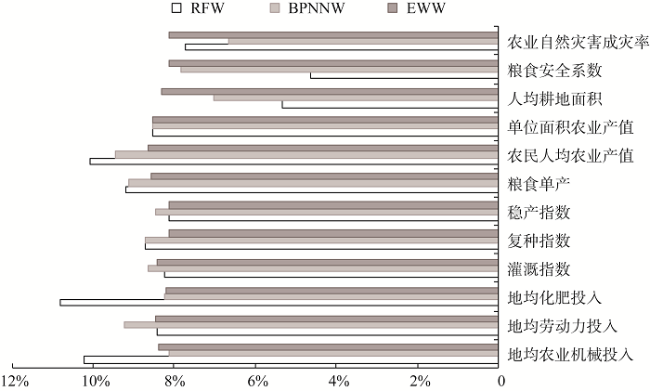
Fig. 4 Values of each index of RFW, BPNNW and EW图4 三种评价方法的指标权重 |
Table 3 Stability test of BPNNW and RFW表3 BPNNW与RFW稳定性检验 |
| 试验 | BPNNW | RFW | 试验 | BPNNW | RFW |
|---|---|---|---|---|---|
| 1 | 1.0000 | 1.0000 | 7 | 0.5000 | 0.9300 |
| 2 | 1.0000 | 1.0000 | 8 | 0.7500 | 0.7500 |
| 3 | 0.9300 | 1.0000 | 9 | 0.9300 | 1.0000 |
| 4 | 0.7500 | 1.0000 | 10 | 1.0000 | 0.7500 |
| 5 | 0.5000 | 1.0000 | 均值 | 0.8110 | 0.9430 |
| 6 | 0.7500 | 1.0000 |
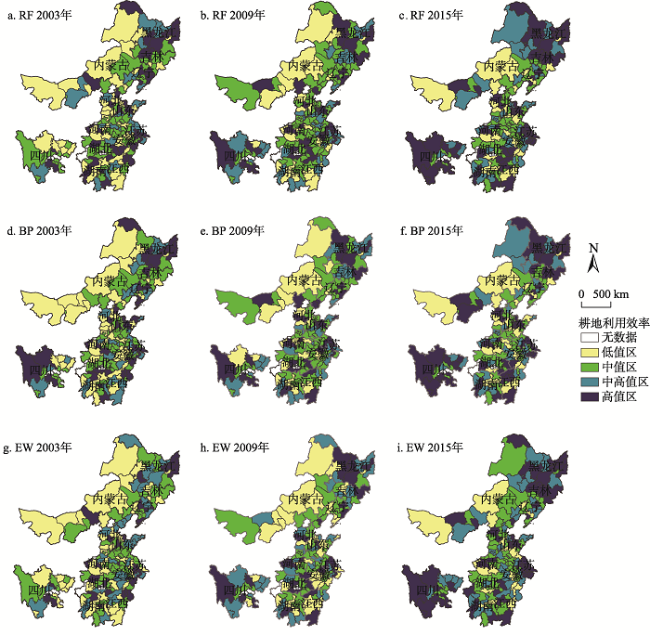
Fig. 5 Spatial distribution of utilization benefit of cultivated land in 2003-2015图5 2003-2015年耕地利用效率空间分布 |
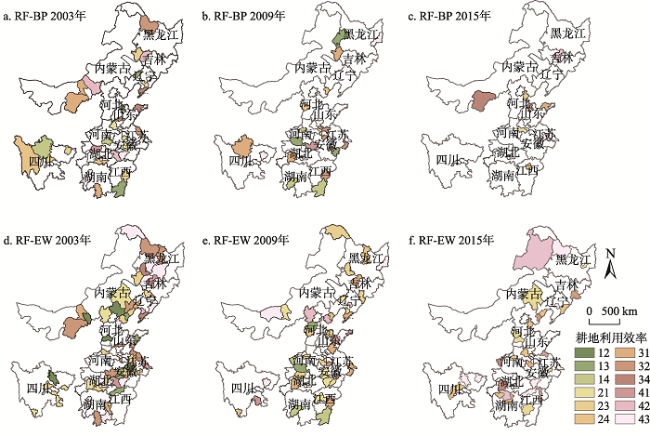
Fig. 6 The difference distribution of the results of RF, BP and EW图6 RF、BP及EW测算结果的差异分布 |
Table 4 Error analysis of measurement表4 测度结果误差分析 |
| 检验 | 标准偏差 | MMSE | MMAE | MRPD | R | 显著性 |
|---|---|---|---|---|---|---|
| RF | 0.1423 | 0.0174 | 0.1119 | 2.3533 | 0.8685 | 0.0000 |
| BPNN | 0.1629 | 0.0211 | 0.1644 | 1.6806 | 0.5722 | 0.1240 |
The authors have declared that no competing interests exist.
| [1] |
|
| [2] |
[
|
| [3] |
|
| [4] |
[
|
| [5] |
[
|
| [6] |
[
|
| [7] |
|
| [8] |
[
|
| [9] |
[
|
| [10] |
|
| [11] |
[
|
| [12] |
|
| [13] |
[
|
| [14] |
|
| [15] |
[
|
| [16] |
[
|
| [17] |
[
|
| [18] |
|
/
| 〈 |
|
〉 |