
西藏土地资源承载力的现实与未来——基于膳食营养当量分析
作者简介:郝庆(1982- ),男,河北邢台人,博士研究生,副研究员,研究方向为国土空间规划与资源环境承载力。E-mail: haoq.16b@igsnrr.ac.cn
收稿日期: 2018-11-24
要求修回日期: 2019-02-28
网络出版日期: 2019-05-28
基金资助
中国科学院战略性先导科技专项(XDA20010201)
Evaluation on land carrying capacity of Tibet based on dietary nutrients:Present and prospects
Received date: 2018-11-24
Request revised date: 2019-02-28
Online published: 2019-05-28
Copyright
土地承载力是人地关系的基础表征,开展土地承载力评价可以为实施农业空间治理、制定农业发展政策等提供参考。以西藏自治区为例,基于人体每日所需热量、蛋白质和脂肪评价土地的现实承载力及其变化。评价结果表明:(1)西藏自治区土地承载指数从2004-2016年一直维持在80.66%~89.84%之间,处于平衡有余状态。(2)未来西藏自治区土地承载指数将会持续保持在87.5%之上,呈现先升后降的变化态势,在2032年达到峰值,届时土地承载指数将会超过92.56%;此后将会持续下降,在2050年将低于90%。以土地承载力评价为基础,根据未来食物消费需求变化和西藏自治区的自然条件,提出不增加农牧业开发强度,保持农牧业生产空间规模稳定,并逐步优化调整农牧业发展结构,适度降低粮食种植面积,在适宜地区扩大蔬菜、瓜果种植,以及发展草牧业经济等建议。
郝庆 , 封志明 , 杨艳昭 , 朱鹤 . 西藏土地资源承载力的现实与未来——基于膳食营养当量分析[J]. 自然资源学报, 2019 , 34(5) : 911 -920 . DOI: 10.31497/zrzyxb.20190501
Land carrying capacity is a fundamental representation of relationship between human and land. Forecasting and evaluating land carrying capacity will bring benefits to agricultural spatial governance, population strategies and agriculture policy-making. Taking the Tibet Autonomous Region as an example, this study evaluates and predicts the actual land carrying capacity and its changes based on the daily calorie, protein and fat of regular human needs. Through analysis, it is found that: (1) The land carrying index of Tibet remained between 80.66% and 89.84% from 2004 to 2016 in a tight balance level. (2) In the future, the land carrying index of Tibet will continue to remain above 87.5%, with a trend of rising first and then falling, and then reaching a peak around 2032, with the proportion of more than 92.56%; it will continue to decline thereafter, with the proportion of less than 90% in 2050. Therefore, based on the evaluation of land carrying capacity and according to the changes in future food consumption and the natural conditions of this region, there is no need to increase the intensity of agricultural and livestock development, but it is matter to reduce the occupation of cultivated land and grassland, such as urban and rural construction, and maintain the current total production space of both agriculture and animal husbandry. Some suggestions are also proposed, including gradually increasing investment in science and technology of agricultural and livestock products to improve the production efficiency, implementing ecological restoration and land remediation. It is necessary to optimize agricultural production structure of Tibet in accordance with these changes in residents' food consumption structure, which includes moderately reducing the area planted with grain, expanding the cultivation of vegetables, fruits and fruits in suitable areas, and developing the economy of grassland and animal husbandry.
Key words: carrying capacity; spatial governance; population; dietary nutrition; Tibet
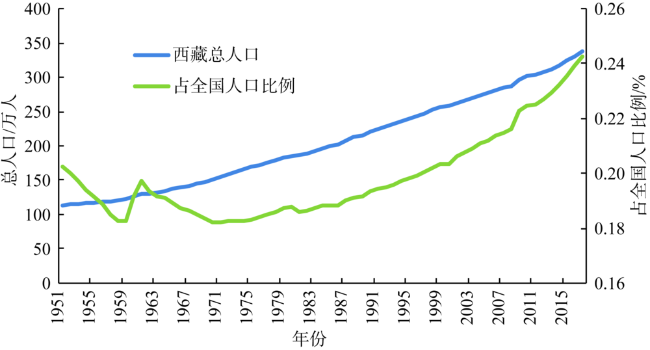
Fig. 1 Total population of the Tibet and its share of the national population during 1951-2017图1 1951-2017年西藏自治区人口总量及占全国人口比例情况 |
Table 1 Energy and nutrient composition of food per kilogram表1 主要食物营养素成分计算表 |
| 项目 | 粮食 | 植物油 | 食糖 | 蔬菜 | 水果 | 肉类 | 蛋类 | 奶类 | 水产品 |
|---|---|---|---|---|---|---|---|---|---|
| 热量/kcal | 3553 | 9000 | 3776 | 180 | 436 | 3915 | 1468 | 690 | 782 |
| 蛋白质/g | 93 | 0 | 4.6 | 11.4 | 6.2 | 99.5 | 123.8 | 33.6 | 125 |
| 脂肪/g | 25.7 | 1000 | 0 | 1.6 | 2.4 | 387.8 | 101.4 | 40.2 | 24.2 |
注:每千克食物营养素提供量。 |
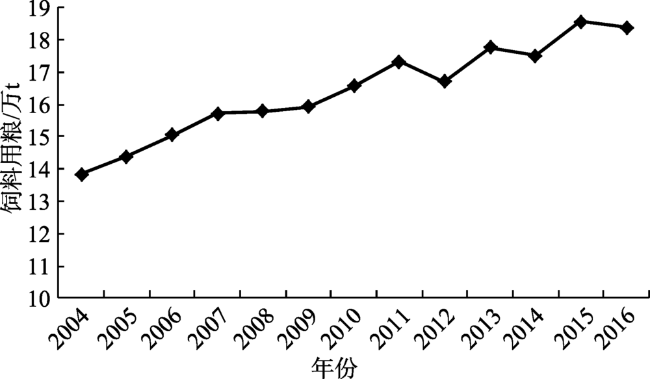
Fig. 2 Estimated data of feed grain of Tibet duing 2004-2016图2 2004-2016年西藏自治区饲料用粮估算数据 |
Table 2 Total energy and nutrient composition of food in Tibet during 2004-2016表2 2004-2016年西藏自治区主要农产品所含营养成分总量 |
| 年份 | 热量/亿kcal | 蛋白质/亿g | 脂肪/亿g |
|---|---|---|---|
| 2004 | 42030.15 | 1099.029 | 1381.806 |
| 2005 | 41826.07 | 1095.85 | 1444.856 |
| 2006 | 41423.57 | 1094.797 | 1451.797 |
| 2007 | 42114.32 | 1117.024 | 1486.149 |
| 2008 | 44528.88 | 1210.103 | 1624.446 |
| 2009 | 41373.56 | 1097.053 | 1516.622 |
| 2010 | 41929.27 | 1113.138 | 1560.286 |
| 2011 | 43241.83 | 1144.161 | 1634.104 |
| 2012 | 43734.65 | 1164.88 | 1610.171 |
| 2013 | 44577.97 | 1190.264 | 1679.419 |
| 2014 | 45271.19 | 1211.312 | 1674.66 |
| 2015 | 46563.42 | 1245.542 | 1748.323 |
| 2016 | 46910.53 | 1257.797 | 1731.519 |
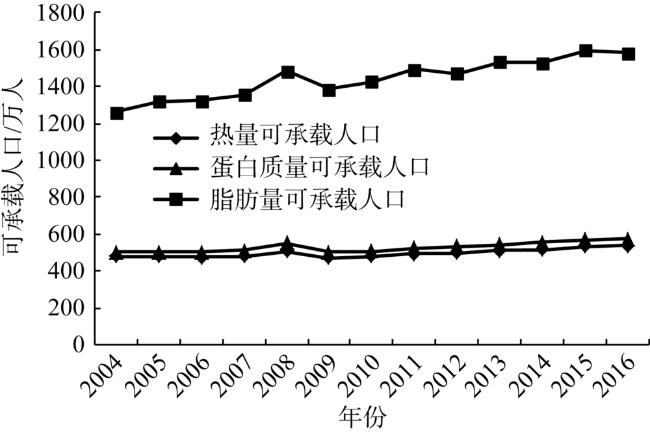
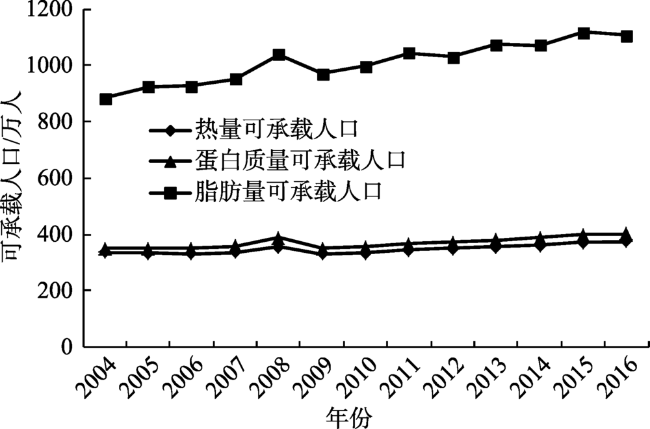
Fig. 3 Land carrying capacity of Tibet during 2004-2016图3 2004-2016年西藏自治区土地承载力 |
Table 3 Population-carrying status of Tibet during 2004-2016表3 2004-2016年基于热量的西藏自治区人口承载状态 |
| 年份 | 可承载力人口/万人 | 实际人口/万人 | 承载指数/% |
|---|---|---|---|
| 2004 | 335.86 | 274.00 | 81.58 |
| 2005 | 334.23 | 277.00 | 82.88 |
| 2006 | 331.01 | 281.00 | 84.89 |
| 2007 | 336.53 | 284.00 | 84.39 |
| 2008 | 355.82 | 287.00 | 80.66 |
| 2009 | 330.61 | 297.00 | 89.83 |
| 2010 | 335.05 | 301.00 | 89.84 |
| 2011 | 345.54 | 303.30 | 87.78 |
| 2012 | 349.48 | 307.62 | 88.02 |
| 2013 | 356.22 | 312.04 | 87.60 |
| 2014 | 361.76 | 317.55 | 87.78 |
| 2015 | 372.08 | 323.97 | 87.07 |
| 2016 | 374.86 | 331.00 | 88.30 |
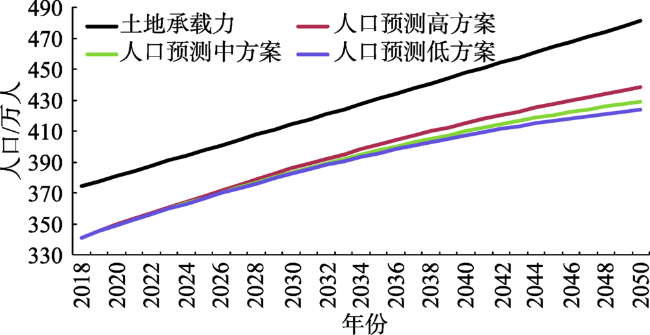
Fig. 5 Population-carrying forecast of Tibet during 2018-2050图5 2018-2050年西藏自治区人口承载预测 |
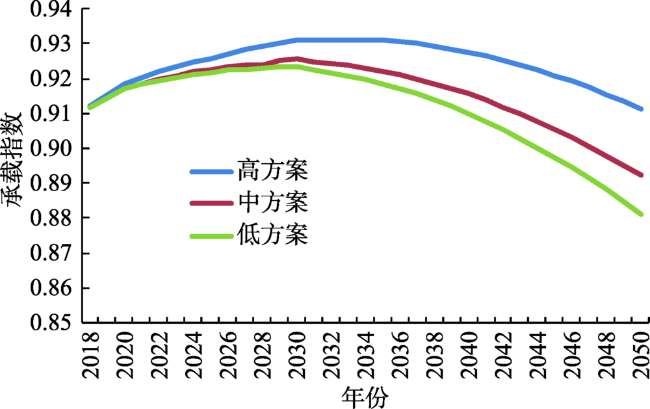
Fig. 6 Prediction of land carrying capacity index of Tibet during 2018-2050图6 2018-2050年西藏自治区土地承载指数预测 |
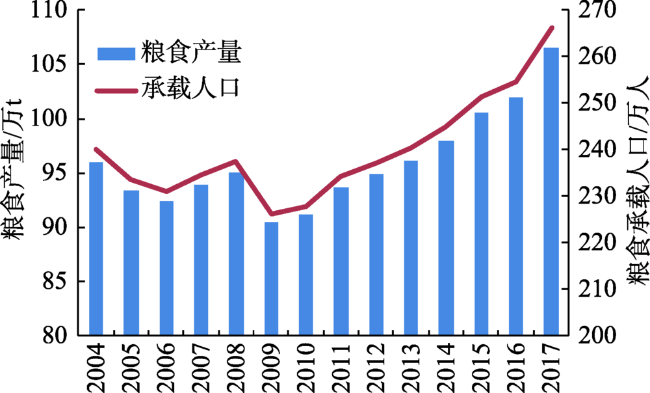
Fig. 7 Grain production and carrying capacity of Tibet during 2004-2017图7 2004-2017年西藏自治区粮食产量及承载人口 |
Fig. 4 Revised land carrying capacity of Tibet during 2004-2016图4 2004-2016年修正后的西藏自治区土地承载力 |
Table 4 Main food consumption and production of Tibet during 2015-2017 (万t) |
| 类别 | 消费量 | 生产量 | 盈余量 | ||||||||
|---|---|---|---|---|---|---|---|---|---|---|---|
| 2015年 | 2016年 | 2017年 | 2015年 | 2016年 | 2017年 | 2015年 | 2016年 | 2017年 | |||
| 粮食 | 89.71 | 93.77 | 95.92 | 100.60 | 101.91 | 106.50 | 10.89 | 8.14 | 10.58 | ||
| 肉类 | 12.67 | 13.62 | 10.05 | 28.00 | 27.72 | 32.10 | 15.33 | 14.10 | 22.05 | ||
| 猪肉 | 2.18 | 3.08 | 2.56 | 1.50 | 1.54 | 1.10 | -0.68 | -1.54 | -1.46 | ||
| 牛肉 | 8.54 | 7.20 | 4.67 | 16.50 | 16.18 | 22.50 | 7.96 | 8.98 | 17.83 | ||
| 羊肉 | 1.89 | 3.17 | 2.65 | 8.20 | 8.23 | 6.40 | 6.31 | 5.06 | 3.75 | ||
| 蛋类 | 0.99 | 0.97 | 1.23 | 0.50 | 0.48 | 0.50 | -0.49 | -0.49 | -0.73 | ||
| 奶类 | 6.94 | 6.76 | 7.58 | 35.00 | 34.70 | 42.00 | 28.06 | 27.94 | 34.42 | ||
| 水果 | 1.96 | 2.26 | 3.40 | 1.50 | 1.53 | 0.20 | -0.46 | -0.73 | -3.20 | ||
Table 5 Food consumption per capita of urban and rural residents of Tibet during 2015-2017 (kg)表5 2015-2017年西藏自治区城乡居民人均食物消费量 |
| 年份 | 粮食(原粮) | 蔬菜 | 猪肉 | 牛肉 | 羊肉 | 禽类 | 水产品 | 蛋类 | 奶类 | 干鲜瓜果类 | |
|---|---|---|---|---|---|---|---|---|---|---|---|
| 城镇 | 2015 | 157.21 | 61.99 | 10.09 | 16.36 | 3.91 | 3.88 | 1.95 | 6.99 | 15.91 | 19.45 |
| 2016 | 148.66 | 62.99 | 9.92 | 27.98 | 3.52 | 3.41 | 1.71 | 6.65 | 16.71 | 21.71 | |
| 2017 | 185.27 | 74.89 | 14.11 | 21.48 | 13.98 | 5.10 | 2.97 | 8.49 | 21.24 | 32.71 | |
| 农村 | 2015 | 313.26 | 13.38 | 5.71 | 29.40 | 6.43 | 0.03 | 0 | 1.86 | 23.09 | 1.98 |
| 2016 | 326.48 | 16.02 | 9.10 | 19.76 | 11.52 | 0.05 | 0 | 1.74 | 21.61 | 2.06 | |
| 2017 | 317.96 | 17.67 | 5.39 | 11.29 | 5.80 | 0.09 | 0 | 2.02 | 22.91 | 2.46 | |
| 城乡差 | 2015 | -156.05 | 48.61 | 4.37 | -13.04 | -2.53 | 3.85 | 1.95 | 5.13 | -7.19 | 17.48 |
| 2016 | -177.82 | 46.97 | 0.82 | 8.22 | -8.00 | 3.36 | 1.71 | 4.91 | -4.90 | 19.65 | |
| 2017 | -132.68 | 57.22 | 8.72 | 10.20 | 8.17 | 5.01 | 2.97 | 6.47 | -1.67 | 30.26 | |
| 均值 | -155.52 | 50.93 | 4.64 | 1.79 | -0.78 | 4.07 | 2.21 | 5.50 | -4.59 | 22.46 | |
| [1] |
|
| [2] |
|
| [3] |
|
| [4] |
[
|
| [5] |
[
|
| [6] |
[
|
| [7] |
|
| [8] |
|
| [9] |
[
|
| [10] |
|
| [11] |
[
|
| [12] |
|
| [13] |
[
|
| [14] |
[
|
| [15] |
[
|
| [16] |
[
|
| [17] |
[
|
| [18] |
[
|
| [19] |
[
|
| [20] |
[
|
| [21] |
[
|
| [22] |
[
|
| [23] |
[
|
| [24] |
[
|
/
| 〈 |
|
〉 |