
多源遥感数据支持下的县域尺度生态效率测算及稳健性检验——以长江中游城市群为例
作者简介:马勇(1959- ),男,湖北武汉人,博士,教授,博士生导师,中组部国家“万人计划”领军人才,研究方向为生态文明与绿色发展。E-mail: mytcn@126.com
收稿日期: 2018-12-03
要求修回日期: 2019-04-01
网络出版日期: 2019-06-20
基金资助
国家社会科学基金青年项目(17CJY051)
湖北省政府智力成果采购重点项目(HBZD201705)
湖北省社会科学基金项目(2015190)
Calculation and robustness test of county-scale ecological efficiency based on multi-source remote sensing data:Taking the urban agglomeration in the Middle Reaches of Yangtze River as an example
Received date: 2018-12-03
Request revised date: 2019-04-01
Online published: 2019-06-20
Copyright
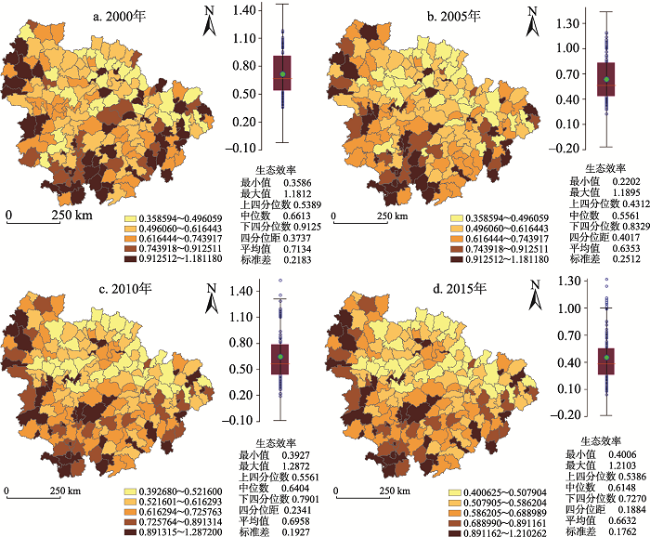
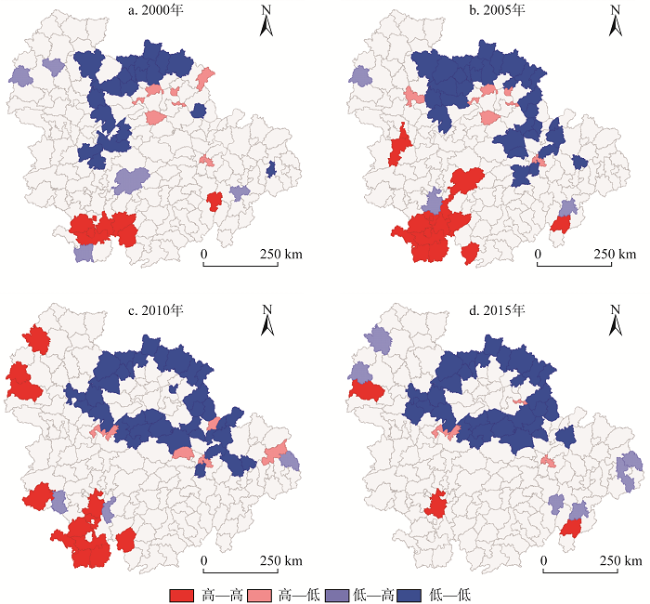
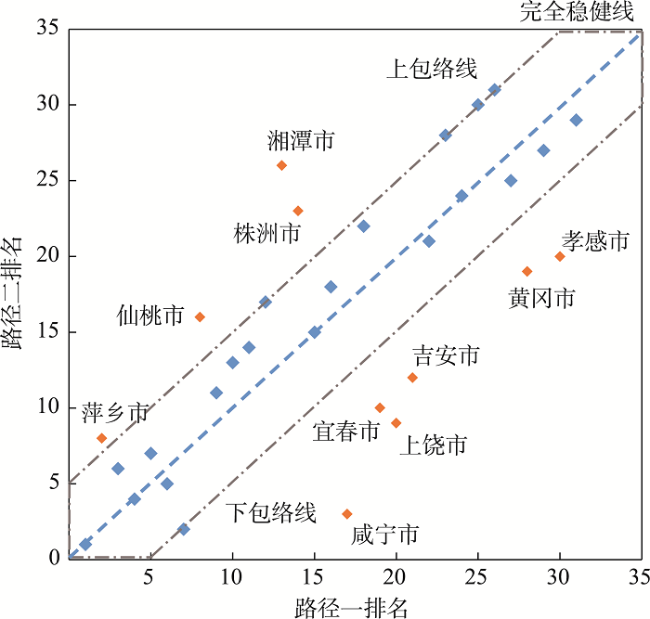
生态效率是评价区域生态文明水平的重要依据,也是地理学与经济学开展资源环境综合研究的常用指标和变量,县域尺度生态效率测度的研究匮乏,制约了上述问题在县域层面上开展。在长江经济带生态优先和绿色发展国家战略下,以长江中游城市群为研究区域,依托多源遥感数据构建县域尺度生态效率测算指标体系,应用非合意产出超效率EBM模型测算2000-2015年县域生态效率,利用GIS空间分析工具揭示其时空分异规律和空间关联特征。并设计稳健性检验方案,对县域尺度生态效率测度路径科学性及稳健性进行检验。结果表明:(1)各年份长株潭城市群和环鄱阳湖城市群所辖县域的生态效率均优于武汉城市圈所辖县域;(2)研究期内生态效率维持高位区域包括武汉市辖区等12个县市,生态效率持续低值区域包括瑞昌市等7个县市;(3)县域生态效率H-H集聚区由衡阳市、株洲市及其周边至2015年成片消失,L-L集聚区则按照顺时针走向,逐步形成围绕武汉市的闭合环形区域;(4)基于市域生态效率排名对比的稳健性检验表明,县域生态效率测度路径和结果具有较高可信度。
马勇 , 童昀 , 任洁 . 多源遥感数据支持下的县域尺度生态效率测算及稳健性检验——以长江中游城市群为例[J]. 自然资源学报, 2019 , 34(6) : 1196 -1208 . DOI: 10.31497/zrzyxb.20190606
Ecological efficiency is an important basis for evaluating the level of regional ecological civilization. It is also a common index and variable for the comprehensive study of resources and environment in geography and economics. The lack of research on the measure of ecological efficiency at the county level has restricted the above-mentioned problems to be researched at the county level. Constructing a scientific path for measuring ecological efficiency at the county level is conducive to accurately identifying the regional economic and social ecological development pattern and providing a possibility for county-level government green performance assessment. Under the national strategy of ecological priority and green development of the Yangtze River economic belt, taking the middle reaches of the Yangtze River as the research area and relying on the multi-source remote sensing data to construct the index system for estimating the ecological efficiency of the county scale, the ecological efficiency of the county area from 2000 to 2015 was calculated by using the non-consensual output EBM super efficiency model, and the GIS spatial analysis tool was used to reveal spatial differences and spatial correlation characteristics. A robust test scheme is designed to test the scientificity and robustness of the county-scale ecoefficiency measurement path. The results show that: (1) The ecological efficiency of the counties under the jurisdiction of Changsha-Zhuzhou-Xiangtan urban agglomeration and Poyang Lake urban agglomeration is better than that of the counties under the jurisdiction of Wuhan urban agglomeration. (2) During the study period, the ecological efficiency of 12 counties and cities such as Wuhan maintained a high level, while that of 7 counties and cities such as Ruichang maintained a low level. (3) The H-H concentration area of ecological efficiency in the early stage is mainly in Hengyang, Zhuzhou and its surrounding areas. By 2015, these areas had disappeared. The L-L agglomeration area of ecological efficiency follows the clockwise trend and gradually forms a closed circular area around the city of Wuhan. (4) The robustness test based on the comparison of city ecological efficiency rankings shows that the measurement path and results of county ecological efficiency constructed in this paper have high reliability.
Table 1 Calculating index system for county ecological efficiency based on multi-source remote sensing data表1 多源遥感数据支持下的县域生态效率测算指标体系 |
| 目标层 | 准则层 | 指标层 | 数据来源 | |
|---|---|---|---|---|
| 县域尺度生态效率 | 投入指标 | 土地投入 | 建设用地面积 | 中国土地利用现状遥感监测数据 |
| 耕地面积 | ||||
| 资源投入 | 能源消耗指数 | DMSP/OLS夜间灯光数据 | ||
| 资本投入 | 全社会固定资产投资 | 《中国县域统计年鉴》《湖北省统计年鉴》《湖南省统计年鉴》《江西省统计年鉴》 | ||
| 劳动力投入 | 年末总人口 | |||
| 产出指标 | 经济产出 | GDP | ||
| 地方财政一般预算收入 | ||||
| 环境产出(非合意) | NO2年均浓度 | 气溶胶反演遥感数据 | ||
| PM2.5年均浓度 | ||||
1.2 数据来源与处理
Fig. 1 Temporal and spatial patterns of ecological efficiency in the urban agglomeration in the Middle Reaches of Yangtze River图1 长江中游城市群县域生态效率时空格局 |
Table 2 Changes of global Moran's I of county ecological efficiency in urban agglomeration in the Middle Reaches of Yangtze River表2 长江中游城市群县域生态效率全局Moran's I变动情况 |
| 年份 | 2000年 | 2005年 | 2010年 | 2015年 | |||||||
|---|---|---|---|---|---|---|---|---|---|---|---|
| Moran's I | P值 | Moran's I | P值 | Moran's I | P值 | Moran's I | P值 | ||||
| 长江中游城市群 | 0.11445 | 0.00859 | 0.21212 | 0.00000 | 0.18925 | 0.00002 | 0.13475 | 0.00204 | |||
| 武汉城市圈 | -0.02282 | 0.92772 | 0.00994 | 0.73398 | 0.20210 | 0.00382 | 0.14273 | 0.03592 | |||
| 长株潭城市群 | 0.26960 | 0.00023 | 0.15202 | 0.02832 | 0.10010 | 0.12535 | 0.02579 | 0.54814 | |||
| 环鄱阳湖城市群 | -0.09085 | 0.45569 | 0.00768 | 0.83375 | -0.11600 | 0.31775 | -0.06161 | 0.64036 | |||
Fig. 2 LISA clustering results of ecological efficiency图2 长江中游城市群县域生态效率LISA聚类结果 |
Table 3 Calculating index system for city ecological efficiency表3 市域生态效率测算指标体系 |
| 目标层 | 准则层 | 指标层 | 单位 | |
|---|---|---|---|---|
| 市域尺度生态效率 | 投入指标 | 资本投入 | 全社会固定资产投资 | 亿元 |
| 劳动力投入 | 就业人员数 | 万人 | ||
| 土地投入 | 建成区面积 | km2 | ||
| 资源投入 | 供水总量 | 万t | ||
| 全社会用电量 | 亿kW·h | |||
| 产出指标 | 经济产出 | GDP | 亿 | |
| 地方财政一般预算收入 | 万元 | |||
| 环境产出(非合意) | 工业废水排放量 | 万t | ||
| 工业二氧化硫排放量 | 万t | |||
| 工业烟(粉)尘排放量 | 万t | |||
Table 4 Results of robustness test表4 稳健性检验结果 |
| 城市 | 路径一 | 路径二 | 排名 差异 | 城市 | 路径一 | 路径二 | 排名 差异 | ||||||
|---|---|---|---|---|---|---|---|---|---|---|---|---|---|
| 生态效率 | 排名 | 生态效率 | 排名 | 生态效率 | 排名 | 生态效率 | 排名 | ||||||
| 鹰潭市 | 1.2220 | 1 | 1.3732 | 1 | 0 | 咸宁市 | 0.9124 | 17 | 1.1154 | 3 | 14 | ||
| 萍乡市 | 1.1052 | 2 | 1.0402 | 8 | -6 | 景德镇市 | 0.8835 | 18 | 0.7912 | 22 | -4 | ||
| 新余市 | 1.0670 | 3 | 1.0541 | 6 | -3 | 宜春市 | 0.8644 | 19 | 1.0231 | 10 | 9 | ||
| 长沙市 | 1.0528 | 4 | 1.1137 | 4 | 0 | 上饶市 | 0.8508 | 20 | 1.0263 | 9 | 11 | ||
| 武汉市 | 1.0522 | 5 | 1.0422 | 7 | -2 | 吉安市 | 0.8393 | 21 | 1.0204 | 12 | 9 | ||
| 鄂州市 | 1.0405 | 6 | 1.0754 | 5 | 1 | 南昌市 | 0.8317 | 22 | 0.8316 | 21 | 1 | ||
| 潜江市 | 1.0337 | 7 | 1.1440 | 2 | 5 | 娄底市 | 0.8274 | 23 | 0.6967 | 28 | -5 | ||
| 仙桃市 | 1.0234 | 8 | 1.0062 | 16 | -8 | 襄阳市 | 0.8040 | 24 | 0.7715 | 24 | 0 | ||
| 常德市 | 1.0131 | 9 | 1.0229 | 11 | -2 | 九江市 | 0.7856 | 25 | 0.6733 | 30 | -5 | ||
| 宜昌市 | 1.0090 | 10 | 1.0096 | 13 | -3 | 黄石市 | 0.7710 | 26 | 0.6316 | 31 | -5 | ||
| 天门市 | 1.0081 | 11 | 1.0092 | 14 | -3 | 益阳市 | 0.7554 | 27 | 0.7566 | 25 | 2 | ||
| 衡阳市 | 1.0025 | 12 | 1.0022 | 17 | -5 | 黄冈市 | 0.7384 | 28 | 0.8646 | 19 | 9 | ||
| 湘潭市 | 1.0001 | 13 | 0.7403 | 26 | -13 | 荆门市 | 0.7184 | 29 | 0.7365 | 27 | 2 | ||
| 株洲市 | 0.9403 | 14 | 0.7736 | 23 | -9 | 孝感市 | 0.6901 | 30 | 0.8606 | 20 | 10 | ||
| 岳阳市 | 0.9320 | 15 | 1.0087 | 15 | 0 | 荆州市 | 0.6516 | 31 | 0.6939 | 29 | 2 | ||
| 抚州市 | 0.9133 | 16 | 0.8957 | 18 | -2 | ||||||||
Fig. 3 Diagram of robustness test results图3 稳健性检验结果示意图 |
The authors have declared that no competing interests exist.
| [1] |
[
|
| [2] |
[
|
| [3] |
[
|
| [4] |
|
| [5] |
[
|
| [6] |
[
|
| [7] |
|
| [8] |
|
| [9] |
[
|
| [10] |
[
|
| [11] |
[
|
| [12] |
[
|
| [13] |
[
|
| [14] |
|
| [15] |
|
| [16] |
|
| [17] |
[
|
| [18] |
[
|
| [19] |
[
|
| [20] |
|
| [21] |
|
| [22] |
|
| [23] |
|
| [24] |
[
|
| [25] |
[
|
| [26] |
[
|
| [27] |
[
|
| [28] |
[
|
| [29] |
[
|
| [30] |
[
|
| [31] |
[
|
| [32] |
|
| [33] |
[
|
| [34] |
|
| [35] |
[
|
| [36] |
|
| [37] |
[
|
| [38] |
[
|
| [39] |
[
|
| [40] |
[
|
/
| 〈 |
|
〉 |