
“一带一路”沿线国家粮食生产的时空格局分析
收稿日期: 2018-10-08
要求修回日期: 2019-02-24
网络出版日期: 2019-06-20
基金资助
中国科学院战略性先导科技专项(XDA20010201);国家自然科学基金项目(41430861)
An evaluation of the Belt and Road cereals production from a view of spatial-temporal patterns
Received date: 2018-10-08
Request revised date: 2019-02-24
Online published: 2019-06-20
Copyright
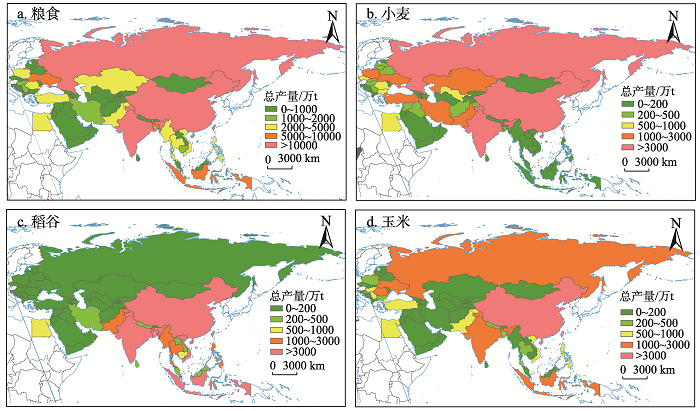
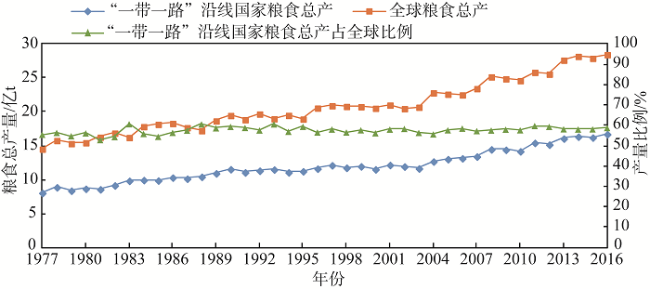
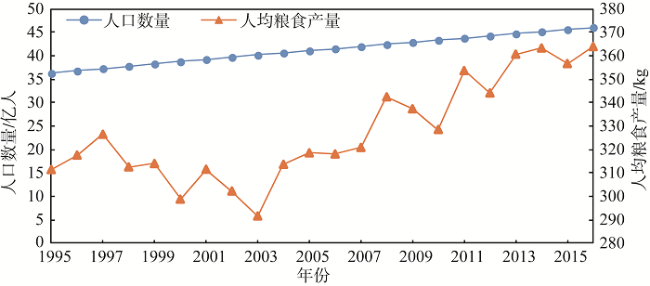
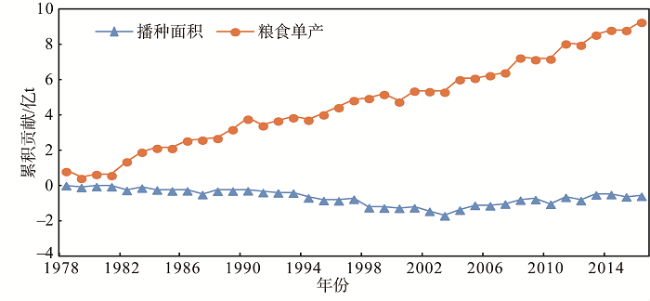
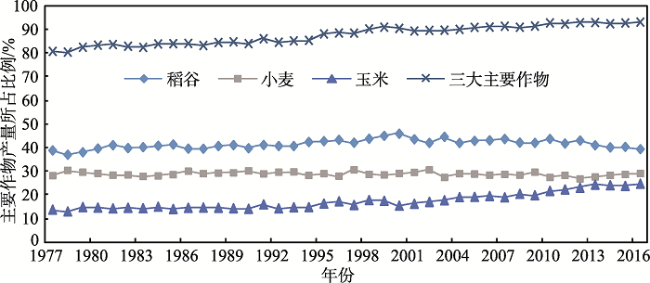
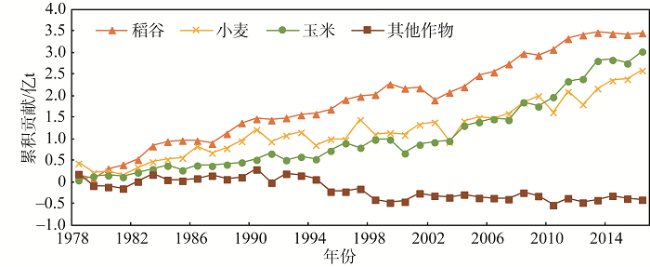
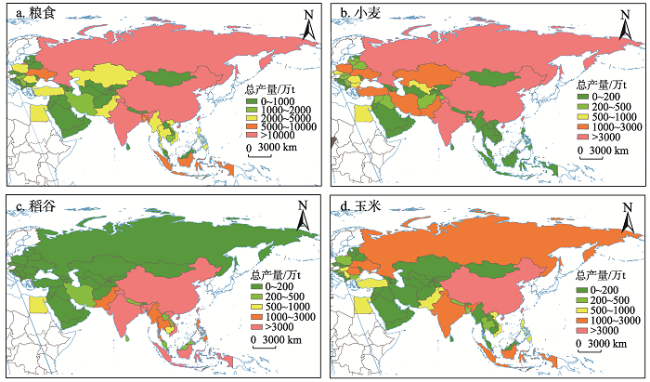
“一带一路”倡议是新时代下全球化发展的必然结果。粮食作为一种重要的战略资源,其生产对“一带一路”沿线国家乃至全球粮食安全意义重大。通过对沿线国家粮食生产数量、结构等方面的深入剖析,揭示了“一带一路”沿线国家近40年来粮食生产的时空格局。结果表明:(1)“一带一路”沿线国家是世界粮食的重要产区,粮食产量占全球比例50%~60%左右,1977-2016年粮食产量呈增长趋势,单产是其粮食总产增长的主要影响因素。1995-2016年人均粮食产量有所提高但国别差异显著,人粮关系逐步改善,区域粮食保障程度整体增强。(2)“一带一路”沿线国家粮食生产存在明显的地域差异,空间格局相对稳定,中国、印度、俄罗斯是其主要粮食生产国,东南亚和南亚国家的粮食产量普遍较高,阿拉伯半岛国家的粮食产量相对较低。(3)稻谷、小麦和玉米是“一带一路”沿线国家主要粮食作物,稻谷对粮食总产变化的贡献最大,1977-2016年玉米占比不断增加,三大作物区域分布特征明显。
关键词: 粮食生产; 时空格局; 地域差异; “一带一路”沿线国家;
贾琨 , 杨艳昭 , 封志明 . “一带一路”沿线国家粮食生产的时空格局分析[J]. 自然资源学报, 2019 , 34(6) : 1135 -1145 . DOI: 10.31497/zrzyxb.20190601
The "Belt and Road" Initiative is the inevitable result of globalization in the new era. As an important strategic resource, food production research is of great significance to regional and global food security. By a quantitative analysis of cereals production, planting area, yield and planting structure, the spatial-temporal patterns and regional differences of countries along the "Belt and Road" were revealed based on time-series data of nearly 40 years. The results showed that: (1) The countries along the "Belt and Road" were important cereals production areas, and the production accounted for 50% to 60% of the world total. A constant growth trend of cereals production was showed during 1977-2016. Per capita cereals production has increased with much difference at country level during 1995-2016, which means the man-grain relationship has been gradually improved and the regional food security has increased. (2) There were obvious regional differences in cereals production in countries along the "Belt and Road", and the spatial pattern was relatively stable. China, India and Russia were high cereals production countries. Cereals production in countries in Southeast and South Asia was generally high, while that in the Arabian Peninsula was relatively low. (3) Rice, wheat and maize were major cereal crops in countries along the "Belt and Road", and rice contributed the most to the total production. The proportions of rice and wheat were relatively stable, but that of maize was increasing. Meanwhile, the regional distribution characteristics of the three major crops were also obvious.
Table 1 Countries along the Belt and Road表1 “一带一路”沿线国家 |
| 六大区域 | 主要国别 |
|---|---|
| 中亚 | 哈萨克斯坦、吉尔吉斯斯坦、塔吉克斯坦、乌兹别克斯坦、土库曼斯坦 |
| 中蒙俄 | 中国、蒙古、俄罗斯 |
| 东南亚 | 越南、老挝、柬埔寨、泰国、马来西亚、新加坡、印度尼西亚、文莱、菲律宾、缅甸、东帝汶 |
| 南亚 | 印度、巴基斯坦、孟加拉国、阿富汗、尼泊尔、不丹、斯里兰卡、马尔代夫 |
| 中东欧 | 波兰、捷克、斯洛伐克、匈牙利、斯洛文尼亚、克罗地亚、罗马尼亚、保加利亚、塞尔维亚、黑山、马其顿、波黑、阿尔巴尼亚、爱沙尼亚、立陶宛、拉脱维亚、乌克兰、白俄罗斯、摩尔多瓦 |
| 西亚/中东 | 土耳其、伊朗、叙利亚、伊拉克、阿联酋、沙特阿拉伯、卡塔尔、巴林、科威特、黎巴嫩、阿曼、也门、约旦、以色列、巴勒斯坦、亚美尼亚、格鲁吉亚、阿塞拜疆、埃及 |
Fig. 1 Changes of cereals production of countries along the Belt and Road and its proportion in the world during 1977-2016图1 1977-2016年“一带一路”沿线国家粮食总产量及占全球比例 |
Fig. 2 Changes of population and per capita cereals production of countries along the Belt and Road during 1995-2016图2 1995-2016年“一带一路”沿线国家人口与人均粮食产量变化趋势 |
Fig. 3 Accumulated effects of main indicators for cereals production changes of countries along the Belt and Road during 1977-2016图3 1977-2016年“一带一路”沿线国家主要因素对粮食总产变化的累积贡献 |
Fig. 4 Production changes of main cereals of countries along the Belt and Road during 1977-2016图4 1977-2016年“一带一路”沿线国家主要粮食作物产量变化趋势 |
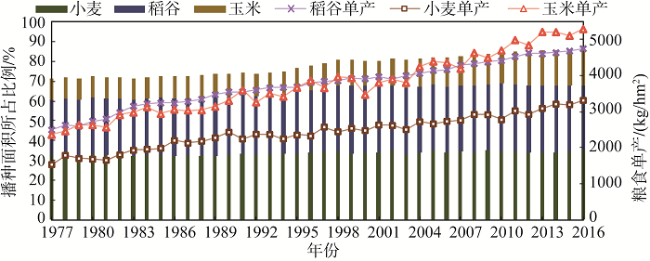
Fig. 5 Changes of harvest areas and yield of main cereals of countries along the Belt and Road during 1977-2016图5 1977-2016年“一带一路”沿线国家主要粮食作物播种面积及单产变化趋势 |
Fig. 6 Accumulated effects of main cereals for production changes of countries along the Belt and Road during 1977-2016图6 1977-2016年“一带一路”沿线国家主要作物对粮食总产变化的累积贡献 |
Table 2 Cereals production and harvest areas of main countries along the Belt and Road during 1977-2016表2 1977-2016年“一带一路”沿线国家主要粮食生产国基本情况 |
| 国家 | 粮食产量/亿t | 份额/% | 播种面积/亿hm2 | 份额/% | |||||||||||||
|---|---|---|---|---|---|---|---|---|---|---|---|---|---|---|---|---|---|
| 1977 年 | 1987 年 | 1997 年 | 2007 年 | 2016 年 | 期初 | 期末 | 1977 年 | 1987 年 | 1997 年 | 2007 年 | 2016 年 | 期初 | 期末 | ||||
| “一带一路”沿线国家 | 8.09 | 10.20 | 12.17 | 13.47 | 16.76 | 100.00 | 100.00 | 4.51 | 4.28 | 4.19 | 4.08 | 4.21 | 100.00 | 100.00 | |||
| 中国 | 2.43 | 3.59 | 4.46 | 4.58 | 5.83 | 30.05 | 34.76 | 0.97 | 0.90 | 0.93 | 0.86 | 0.97 | 21.59 | 22.96 | |||
| 俄罗斯 | — | — | 0.87 | 0.80 | 1.18 | — | 7.03 | — | — | 0.48 | 0.40 | 0.44 | — | 10.56 | |||
| 印度 | 1.38 | 1.56 | 2.23 | 2.60 | 2.95 | 17.06 | 17.58 | 1.04 | 0.99 | 1.00 | 1.01 | 0.98 | 23.02 | 23.40 | |||
| 印度尼西亚 | 0.27 | 0.45 | 0.58 | 0.70 | 0.98 | 3.34 | 5.83 | 0.11 | 0.13 | 0.14 | 0.16 | 0.18 | 2.43 | 4.29 | |||
| 哈萨克斯坦 | — | — | 0.12 | 0.20 | 0.20 | — | 1.22 | — | — | 0.14 | 0.15 | 0.15 | — | 3.60 | |||
| 乌克兰 | — | — | 0.34 | 0.29 | 0.65 | — | 3.89 | — | — | 0.14 | 0.13 | 0.14 | — | 3.33 | |||
Fig. 7 Distribution of cereals production in countries along the Belt and Road in 2016图7 2016年“一带一路”沿线国家粮食总产量空间分布 注:本图基于国家测绘地理信息局标准地图服务网站下载审图号为GS(2016)1666号的标准地图制作,底图无修改,下同。 |
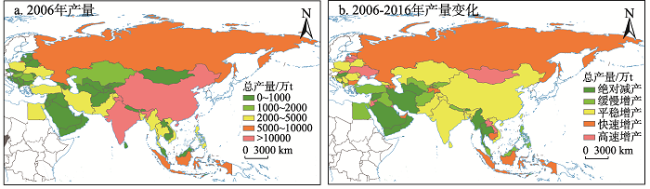
Fig. 8 Distribution of cereals production in 2006 and changes in 2006-2016 in countries along the Belt and Road图8 2006-2016年“一带一路”沿线国家粮食产量空间分布与变化 |
Table 3 Cereals production increase along the Belt and Road during 2006-2016表3 2006-2016年“一带一路”沿线国家粮食增产情况 |
| 类型 | 绝对减产 | 缓慢增产 | 稳定增产 | 快速增产 | 高速增产 |
|---|---|---|---|---|---|
| 增幅 | F<0 | 0≤F<20% | 20%≤F<40% | 40%≤F<60% | F≥60% |
| 数量/个 | 13 | 12 | 18 | 9 | 10 |
| 占比/% | 20.97 | 19.35 | 29.03 | 14.52 | 16.13 |
Fig. 9 Per capita cereals production of countries along the Belt and Road in 2016图9 2016年“一带一路”沿线国别人均粮食产量 |
The authors have declared that no competing interests exist.
| [1] |
[
|
| [2] |
[
|
| [3] |
[
|
| [4] |
[
|
| [5] |
[
|
| [6] |
[DU D B. MA Y H.One Belt and One Road: The grand geo-strategy of China's rise. Geographical Research, 2015, 34(6): 1005-1014.]
|
| [7] |
[
|
| [8] |
[
|
| [9] |
[
|
| [10] |
[
|
| [11] |
[
|
| [12] |
[
|
| [13] |
[
|
| [14] |
[
|
| [15] |
[
|
| [16] |
[
|
| [17] |
[
|
| [18] |
[
|
| [19] |
[
|
| [20] |
[
|
| [21] |
[
|
| [22] |
[
|
| [23] |
[
|
/
| 〈 |
|
〉 |
