
1977-2017年萨吾尔山冰川变化及其对气候变化的响应
作者简介:王炎强(1989- ),男,山西运城人,博士研究生,主要从事环境遥感及GIS应用研究。E-mail: wyyq0203@163.com
收稿日期: 2018-07-09
要求修回日期: 2018-12-03
网络出版日期: 2019-04-20
基金资助
国家重大科学研究计划(2013CBA01801)
国家自然科学基金项目(41471058,41641003,41601076)
中国科学院战略性先导科技专项(A类)(XDA2006020103)
Glacier changes in the Sawuer Mountain during 1977-2017 and their response to climate change
Received date: 2018-07-09
Request revised date: 2018-12-03
Online published: 2019-04-20
Copyright
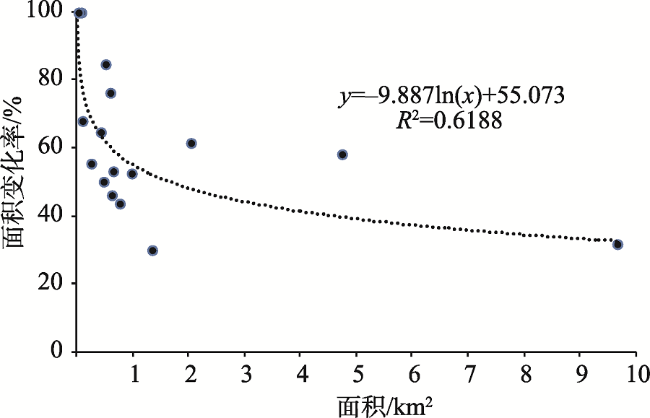
利用1977年MSS和1989年、1998年、2006年TM及2017年OLI/TIRS遥感影像资料,通过目视解译和GIS技术,提取萨吾尔山地区五个时期的冰川信息,同时对研究区周边气温降水的趋势性和周期性进行分析,探讨该地区最近40年冰川对气候变化的响应。研究表明: (1)1977-2017年,研究区冰川总面积减小了10.51 km2,退缩45.72%,退缩速率为1.14%·a-1,且冰川处于加速退缩阶段;(2)冰川规模越小,退缩越快;(3)南坡退缩速度最快,东南坡和西南坡次之,东北坡退缩最慢,冰川退缩率在5°~40°坡度大体呈现随坡度增大而增加的趋势;(4)研究区正处于气温上升期,降水增加期,降水量增加幅度不能弥补由气温升高造成的冰川消融,引起冰川退缩速率不断加快;(5)与其他因素主导区域的冰川相比,研究区冰川退缩率较高,面积较小的冰川占比较多是形成这一结果的另一因素。
王炎强 , 赵军 , 李忠勤 , 张明军 . 1977-2017年萨吾尔山冰川变化及其对气候变化的响应[J]. 自然资源学报, 2019 , 34(4) : 802 -814 . DOI: 10.31497/zrzyxb.20190410
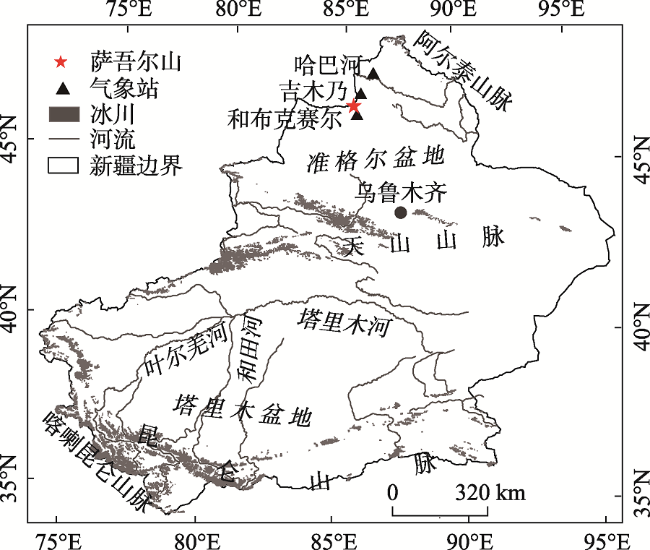
The Sawuer Mountain spans the two countries between China and Kazakhstan and is the transitional section between the Tianshan Mountains and the central Altay Mountains. This mountain range is not only the most obvious watershed for the inland and Arctic sea systems in Xinjiang, but also the highest mountain in the northernmost part of the western Junggar Basin. Muz Taw Mountain is the main peak of the Sawuer Mountain and Muz Taw Glacier in the peak is the most important tourist resource in Jimunai county. The northern slope of the study area runs through a glacier snow-fed river, the Ulejkururasu River, which is also a boundary river between China and Kazakhstan. Glaciers, as the alpine solid reservoir, whose river runoff by ablation plays a very important role in the survival and development of agriculture and livestock husbandry in the middle and lower reaches of arid regions. Meanwhile, glaciers also affect the sustainable development of ecological environment and social economy in a large extent. Therefore, it is possible to predict future changes in the glacier and the future development of the area affected by the glacier via understanding the changing trends of glaciers and their response to climate change. Based on the Landsat 1977 MSS, 1989 TM, 1998 TM, 2006 TM and 2017 OLI / TIRS remote sensing image data, the glacier information of five periods in the Uighur region was extracted by visual interpretation and GIS technology. The trend and periodicity of temperature and precipitation were analyzed to investigate the response of the glaciers to climate change in recent 40 years in the region. The results show that: (1) From 1977 to 2017, the total glacier area in the study region decreased by 10.51 km2, retreating by 45.72%, and the retreat rate was 1.14%·a-1, with the glacier retreating at an accelerating stage. (2) The smaller the glacier scale, the faster the retreat speed; (3) The south slope retreats fastest, followed by the southeast slope and the southwest slope, and the slowest retreat is in the northeast slope, and the gradient of the glacier shrinkage at 5°-40° generally shows a trend of increasing with the increase of the slope; (4) The study region is in the period of temperature rise and precipitation increase, and the increase of precipitation cannot make up for the glacier ablation caused by the temperature increase, leading to the accelerating retreating rate of glacier. (5) Compared with the glaciers dominated by other factors, the glacier retreats. More glaciers with higher retreat rates and smaller areas is another factor in forming this result.
Key words: Sawuer Mountain; glacier change; climate change; remote sensing
Fig. 1 Map showing the location of the Sawuer Mountain图1 萨吾尔山位置 |
Table 1 Images used in this study表1 萨吾尔山遥感影像信息 |
| ID | 接受日期 | 传感器 | 分辨率/m | 轨道号 | 云量/% | 影像说明 |
|---|---|---|---|---|---|---|
| LM21560271977246AAA03 | 1977-09-03 | MSS | 60 | 156/27 | 1 | 解译影像 |
| LT41440271989237XXX01 | 1989-08-25 | TM | 30 | 144/27 | 0 | 解译影像 |
| LT51450271998245BIK00 | 1998-09-02 | TM | 30 | 144/27 | 0 | 解译影像 |
| LE71450272000227SGS00 | 2000-08-14 | ETM+ | 30 | 145/27 | 0 | 参考影像 |
| LT51450272006251IKR00 | 2006-09-08 | TM | 30 | 145/27 | 0 | 解译影像 |
| LC81450272015196LGN01 | 2015-07-15 | OLI/TIRS | 30 | 145/27 | 0 | 参考影像 |
| LC81440272017210LGN00 | 2017-07-29 | OLI/TIRS | 30 | 144/27 | 4 | 解译影像 |
Table 2 Meteorological stations used in this study表2 研究区气象站的基本信息 |
| 站名 | 经度/E | 纬度/N | 海拔高度/m | 资料时段/年 |
|---|---|---|---|---|
| 吉木乃 | 85°52′ | 47°26′ | 984 | 1961-2016 |
| 和布克赛尔 | 85°43′ | 46°47′ | 1292 | 1961-2016 |
| 哈巴河 | 86°24′ | 48°03′ | 533 | 1961-2016 |
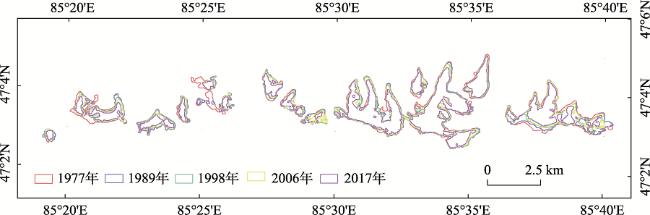
Fig. 2 Glacial border distribution in the Sawuer Mountain图2 萨吾尔山冰川边界分布 |
Table 3 Glacier area variation of Sawuer Mountain from 1977 to 2017表3 1977-2017年萨吾尔山冰川面积变化情况 |
| 时间/年 | 冰川面积/km2 | 时段/年 | 面积减少量/km2 | 面积退缩率/% |
|---|---|---|---|---|
| 1977 | 23.00 | |||
| 1989 | 20.02 | 1977-1989 | 2.98 | 12.96 |
| 1998 | 17.96 | 1989-1998 | 2.06 | 10.29 |
| 2006 | 16.06 | 1998-2006 | 1.90 | 10.58 |
| 2017 | 12.49 | 2006-2017 | 3.57 | 22.23 |
| 1977-2017 | 10.52 | 45.70 |
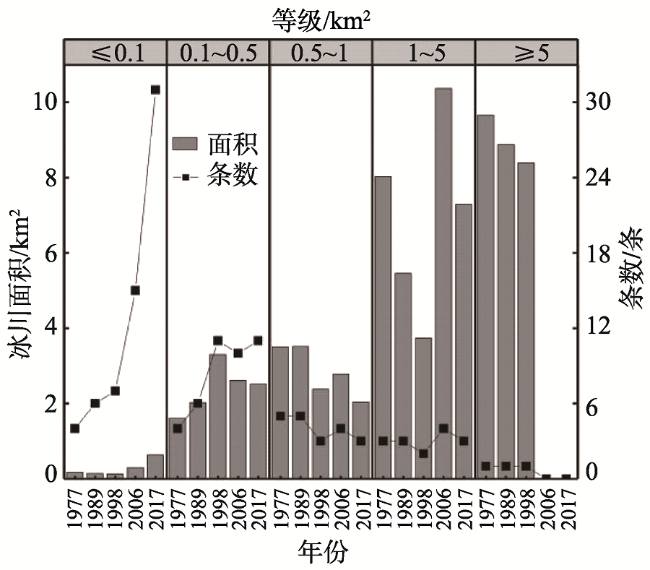
Fig. 3 Area and number distribution of glaciers of different sizes图3 不同规模冰川面积和条数分布 |
Fig. 4 The proportion of single glacier retreat from 1977 to 2017图4 1977-2017年单条冰川面积退缩率 |
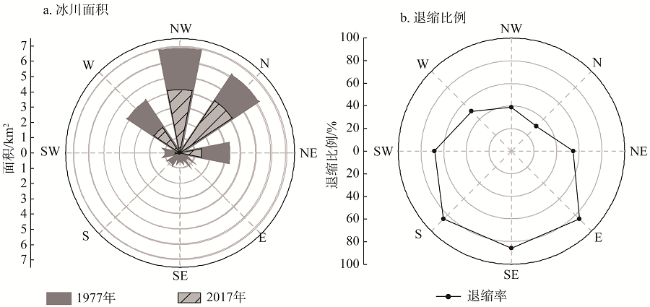
Fig. 5 Distribution and retreat rate of glaciers of different aspects during 1977-2017图5 1977-2017年不同坡向冰川面积分布及退缩比例 |
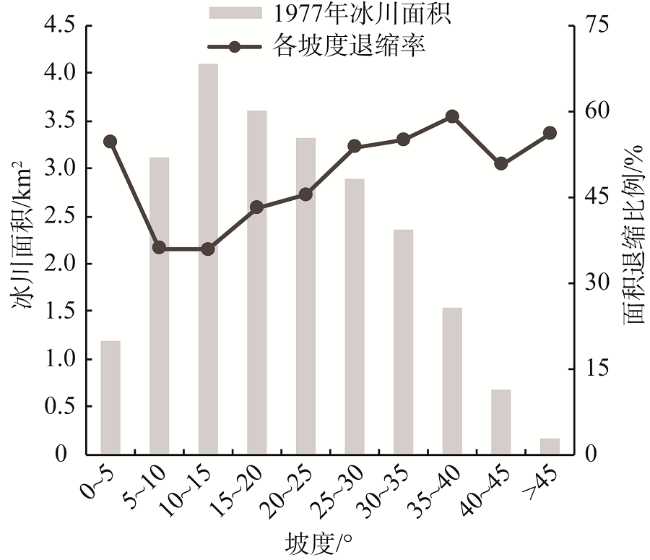
Fig. 6 Distribution and retreat rate of glaciers of different slopes during 1977-2017图6 1977-2017年不同坡度冰川分布及退缩率 |
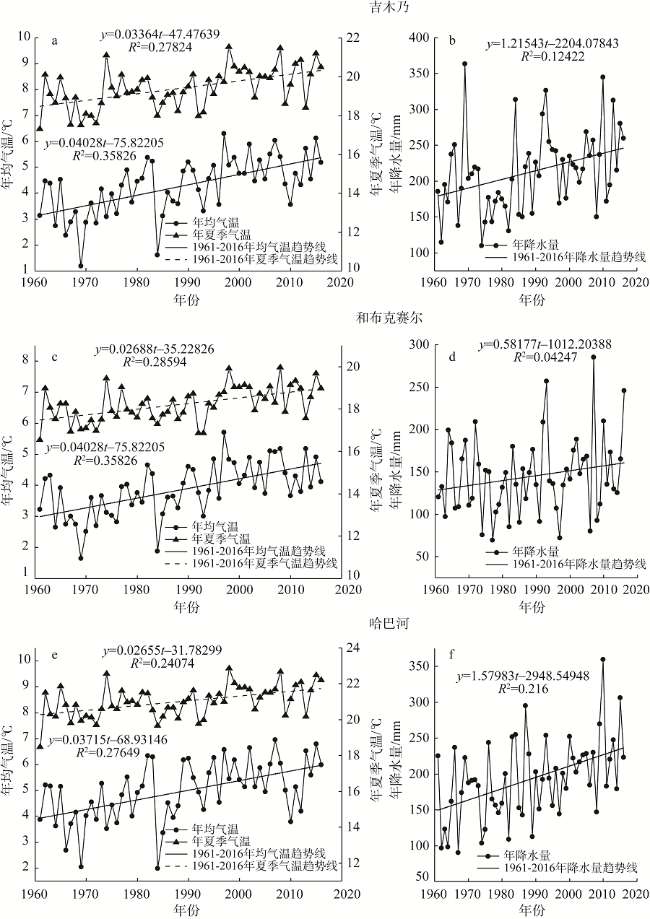
Fig. 7 The variation of average annual temperature, average summer temperature and annual precipitation图7 年均气温、夏均气温和年降水量变化 |
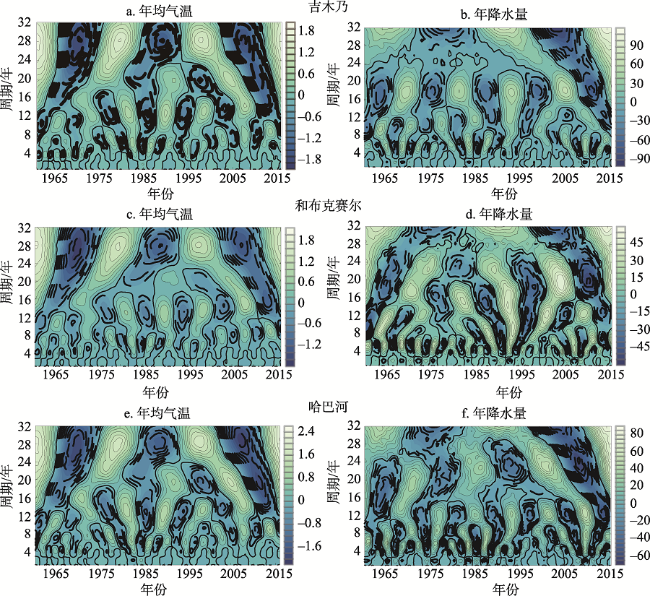
Fig. 8 The contour map of the real part of Morlet wavelet transformation coefficient of annual temperature and precipitation图8 Morlet小波变换小波系数实部的时频分布|||注:正负值分别用实线和虚线表示,零值用加粗实线表示。 |
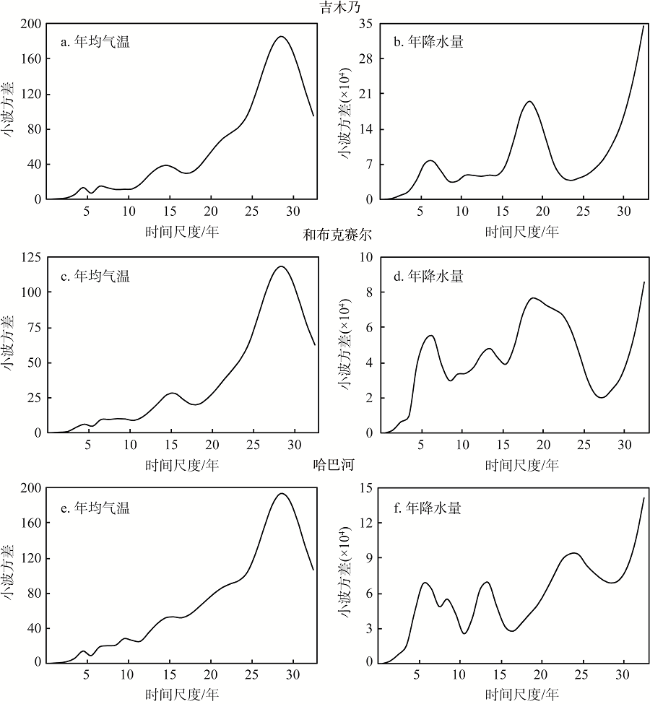
Fig. 9 The map of wavelet variance图9 小波方差图 |
Table 4 Comparison of glacier changes in different regions表4 不同主导因素区域冰川变化比较 |
| 主导因素 | 研究区域 | 研究时段/年 | 面积退缩率/% | 年均退缩率/% | 数据源 | 资料来源 |
|---|---|---|---|---|---|---|
| 中间西风 | 叶尔羌河流域 | 1968-2009 | 14.62 | 0.36 | 地形图、TM、ETM+ | 冯童等[29] |
| 努布拉流域 | 1993-2015 | 4.64 | 0.20 | TM、ETM+、OLI/TIRS | 刘凯等[30] | |
| 克勒青河流域 | 1978-2015 | 8.00 | 0.22 | MSS、TM、ETM+、OLI/TIRS | 许艾文等[31] | |
| 西昆仑峰区 | 1990-2011 | 0.65 | 0.03 | TM、ETM+ | 李成秀等[32] | |
| 东帕米尔高原 | 1972-2011 | 5.79 | 0.15 | MSS、TM、ETM+ | 曾磊等[33] | |
| 印度季风 | 喜马拉雅山东段 | 1980-2007 | 16.40 | 0.61 | 地形图、TM、ETM+ | 李治国等[34] |
| 西风带北支 | 天山 | 1960-2007 | 11.50 | 0.31 | — | 王圣杰等[35] |
| 乌鲁木齐河源1号 | 1962-2006 | 14.00 | 0.32 | 地形图、航片 | 李忠勤等[36] | |
| 台兰河流域 | 1972-2011 | 11.50 | 0.29 | 地形图、ETM+ | 怀保娟等[37] | |
| 奎屯河流域 | 1964-2015 | 32.60 | 0.64 | 地形图、ETM+、OLI/TIRS | 张慧等[38] | |
| 萨吾尔山 | 1977-2017 | 45.72 | 1.14 | MSS、TM、ETM+、OLI/TIRS | 本文 |
The authors have declared that no competing interests exist.
| [1] |
|
| [2] |
[
|
| [3] |
[
|
| [4] |
[
|
| [5] |
[
|
| [6] |
[
|
| [7] |
[
|
| [8] |
|
| [9] |
|
| [10] |
|
| [11] |
[
|
| [12] |
[
|
| [13] |
[
|
| [14] |
[
|
| [15] |
[
|
| [16] |
[
|
| [17] |
[
|
| [18] |
[
|
| [19] |
|
| [20] |
|
| [21] |
|
| [22] |
UNFCCC. Decision 1/ CP. 23: The Memorandum of Understanding Agreement: WMO's Annual Statements on the State of the Climate. The twenty-three session of the Conference of the Parties to the UNFCCC; 2017 Nov 6-Nov 10; Bonn, Germany.
|
| [23] |
|
| [24] |
[
|
| [25] |
|
| [26] |
[
|
| [27] |
|
| [28] |
[
|
| [29] |
[
|
| [30] |
[
|
| [31] |
[
|
| [32] |
[
|
| [33] |
[
|
| [34] |
[
|
| [35] |
[
|
| [36] |
[
|
| [37] |
[
|
| [38] |
[
|
| [39] |
|
/
| 〈 |
|
〉 |