
气候和人类活动对典型岩溶地下河系统径流年际变化的影响
作者简介:王赛男(1995- ),女,四川彭州人,硕士,研究方向为岩溶环境与全球变化。E-mail: sainanwang00@163.com
收稿日期: 2018-09-01
要求修回日期: 2018-12-25
网络出版日期: 2019-04-20
基金资助
国家重点研发计划课题(2016YFC0502501)
国家自然科学基金项目(41572234)
广西自然科学基金项目(2017GXNSFFA198006)
Impacts of climate change and human activities on the interannual flow changes in a typical karst subterranean river, South China
Received date: 2018-09-01
Request revised date: 2018-12-25
Online published: 2019-04-20
Copyright
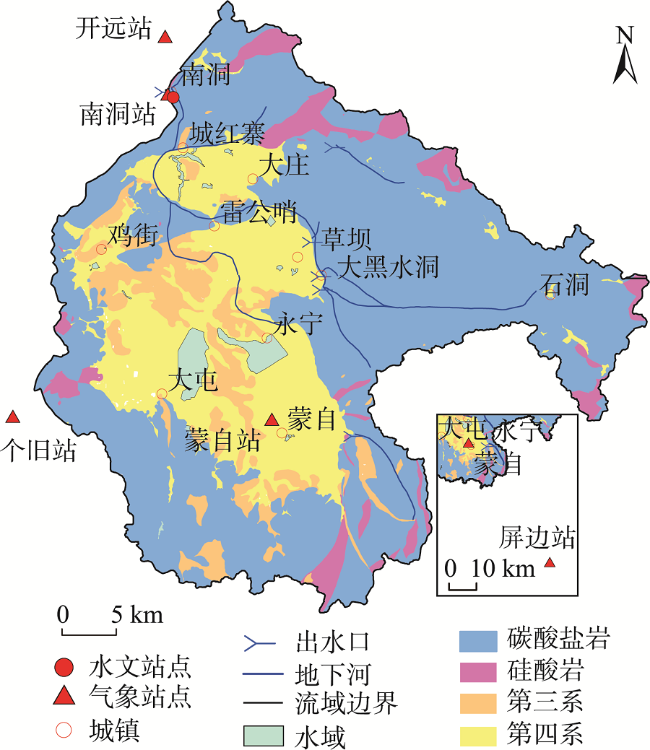
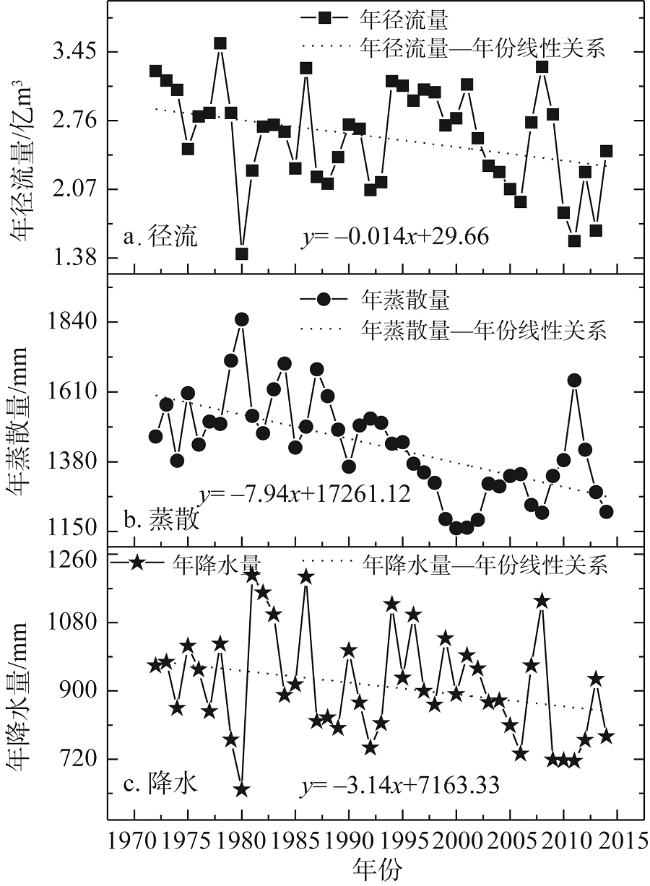
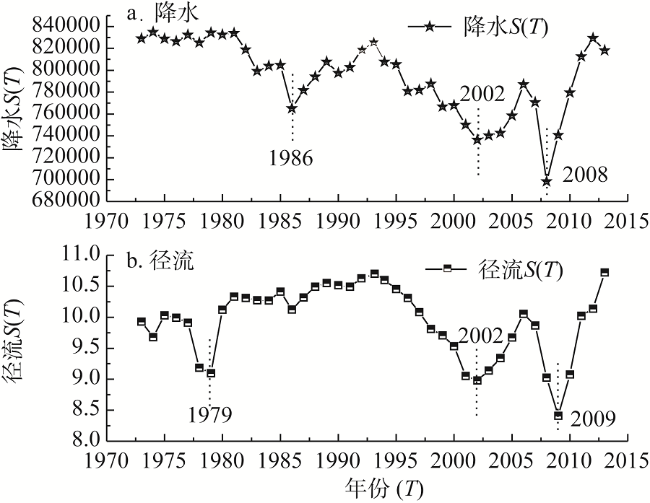
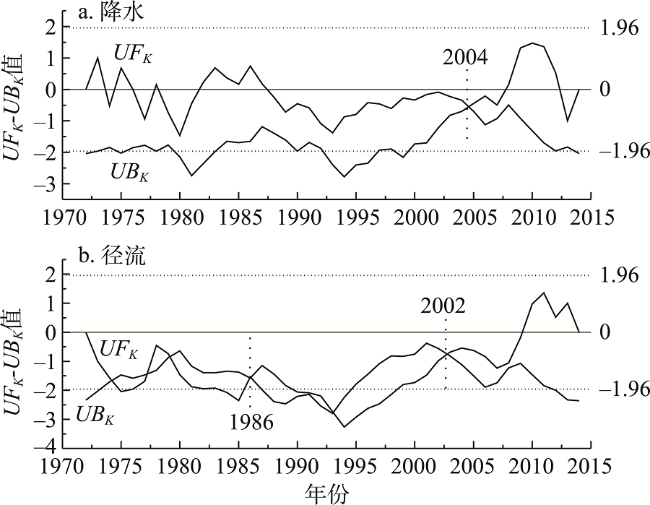
为揭示气候变化与人类活动对岩溶地下河系统年径流量的影响,以南洞地下河为研究对象,利用其1972-2014年的径流量、降水量和蒸散量数据,分析其年际变化特征。研究结果表明:研究期内径流、降水和蒸散均呈现波动减少的趋势。其中流域内径流整体以0.014亿m3/a的速度减少,降水整体以3.14 mm/a的速度减少,蒸散整体以7.94 mm/a的速度减少。通过有序聚类法和Mann-Kendall法综合确定出径流、降水的突变年份为2002年、2008年。通过累积量斜率变化率比较法,定量分解了不同时期气候与人类活动对径流变化影响的贡献率:综合考虑降水和蒸散因素,以人类活动轻微的T1(1972-2002年)阶段为基准期,气候变化对径流减少的贡献率在T2(2003-2008年)、T3(2009-2014年)时期分别为-86.68%、35.92%,人类活动对径流减少的贡献率在T2、T3阶段分别为186.68%、64.08%。可见,人类活动是南洞地下河流域径流量年际变化的主导因素,其中生活、生产的直接耗水和土地利用/土地覆被变化影响下径流过程的变化,共同影响着径流年际变化。
关键词: 气候变化; 人类活动; 径流量; 累积量斜率变化率比较法; 南洞地下河
王赛男 , 李建鸿 , 蒲俊兵 , 霍伟杰 , 张陶 , 黄思宇 , 袁道先 . 气候和人类活动对典型岩溶地下河系统径流年际变化的影响[J]. 自然资源学报, 2019 , 34(4) : 759 -770 . DOI: 10.31497/zrzyxb.20190407
Quantifying the impacts of climate change and human activities on runoff changes is one of challenges in hydrology and water resources researches. In order to reveal the impacts of climate change and human activities on the interannual flow of a karst subterranean river system, this study chose a big karst subterranean river in south China, Nandong subterranean river (NSR) as a research area to analyse the interannual variations of precipitation, evapotranspiration and flow based on the data of flow, evapotranspiration and precipitation of NSR from 1972 to 2014. The results indicated that precipitation, evapotranspiration and flow of NSR during the study period showed a fluctuating decline trend, in which the overall declining rates of precipitation, evapotranspiration and flow were 3.14 mm/a, 7.49 mm/a and 0.014×10⁸ m3/a, respectively. Two inflection-point years in the variations of precipitation and flow, 2002 and 2008 were identified through the sequential clustering and Mann-Kendall test methods. The method of slope changing ratio of cumulative quantity was adopted in estimation of the contributions of climate change and human activities to the flow variations in NSR. Considering the influence of evapotranspiration in NSR, the results, with 1972-2002 as the base period, indicated less effect from human activities. The contribution rates of the climate changes to the flow changes were -86.68% in the T2 period (2003-2008), and 35.92% in the T3 period (2009-2014), while the contribution rates of human activities were 186.68% in the T2 period and 64.08% in the T3 period. Obviously, human activities were the dominant factor causing the interannual flow change in NSR catchment. Direct water consumption of production and living and the changes of flow processes under the influences of land use/land cover changes exerted a main influence on the interannual flow changes. The results can give us a better understanding of the variation characteristics under the impacts of climate change and human activities and help to reasonably regulate karst water resources.
Fig. 2 Interannual variations of precipitation and flow and evapotranspiration in Nandong subterranean river catchment during 1972-2014图2 南洞地下河流域1972-2014年降水量、年径流量、年蒸散量变化 |
Fig. 3 S(T) change process based on the sequential clustering method for the annual precipitation and flow series in the Nandong subterranean river catchement图3 基于有序聚类分析法的南洞地下河流域径流与降水S(T) 值变化过程 |
Fig. 4 UFK and UBK change process based on Mann-Kendall test method for the annual precipitation and flow series in the Nandong subterranean river catchement图4 基于Mann-Kendall法的南洞地下河流域降水和径流UFK-UBK值变化过程 |
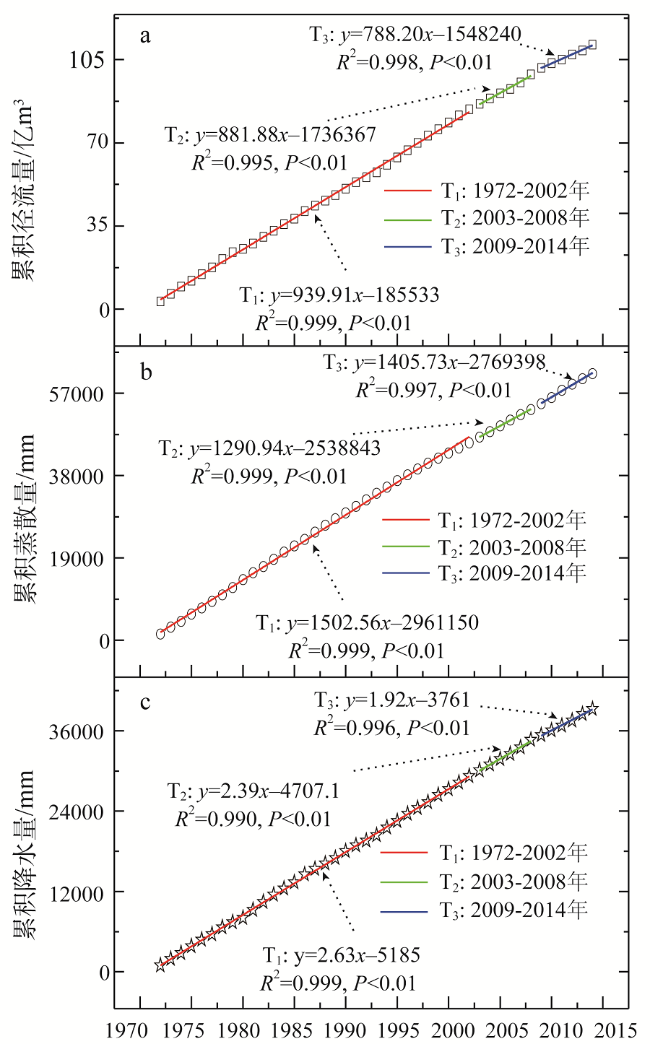
Fig. 5 Interannual variations of accumulative factors图5 累积量变化趋势 |
Table 1 Slope change ratio of cumulative quantity in different periods表1 不同时期年份与各累积量斜率及其变化 |
| 时期 | 累积量斜率 | 斜率改变率 | ||||
|---|---|---|---|---|---|---|
| /年 | 降水/(mm/a) | 径流/(亿m3/a) | 蒸散/(mm/a) | 降水/% | 径流/% | 蒸散/% |
| T1: 1972-2002 | 939.91 | 2.63 | 1502.56 | — | — | — |
| T2: 2003-2008 | 881.88 | 2.39 | 1290.94 | -6.17 | -9.13 | -14.08 |
| T3: 2009-2014 | 788.20 | 1.92 | 1405.73 | -16.14 | -27.00 | -6.44 |
Table 2 Contributions of climate and human activities to the changes of flow表2 气候与人类活动对径流量变化的贡献 |
| 时期/年 | 贡献率/% | |||
|---|---|---|---|---|
| 降水 | 蒸散 | 气候变化 | 人类活动 | |
| T1: 1972-2002 | — | — | — | — |
| T2: 2003-2008 | 67.66 | -154.34 | -86.68 | 186.68 |
| T3: 2009-2014 | 59.79 | -23.87 | 35.92 | 64.08 |
Table 3 Proportion of land use types in Nandong subterranean river catchment during 1990-2010 (%)表3 1990-2010年南洞地下河流域土地利用结构 |
| 土地利用类型 | 1990年 | 1995年 | 2000年 | 2005年 | 2010年 |
|---|---|---|---|---|---|
| 比例 | 比例 | 比例 | 比例 | 比例 | |
| 耕地 | 30.39 | 30.04 | 29.69 | 40.31 | 50.07 |
| 森林 | 27.31 | 27.31 | 27.31 | 14.60 | 13.43 |
| 草地 | 37.35 | 37.35 | 37.35 | 39.08 | 30.43 |
| 水体 | 2.51 | 2.51 | 2.51 | 2.70 | 2.45 |
| 建设用地 | 2.44 | 2.79 | 3.14 | 3.31 | 3.62 |
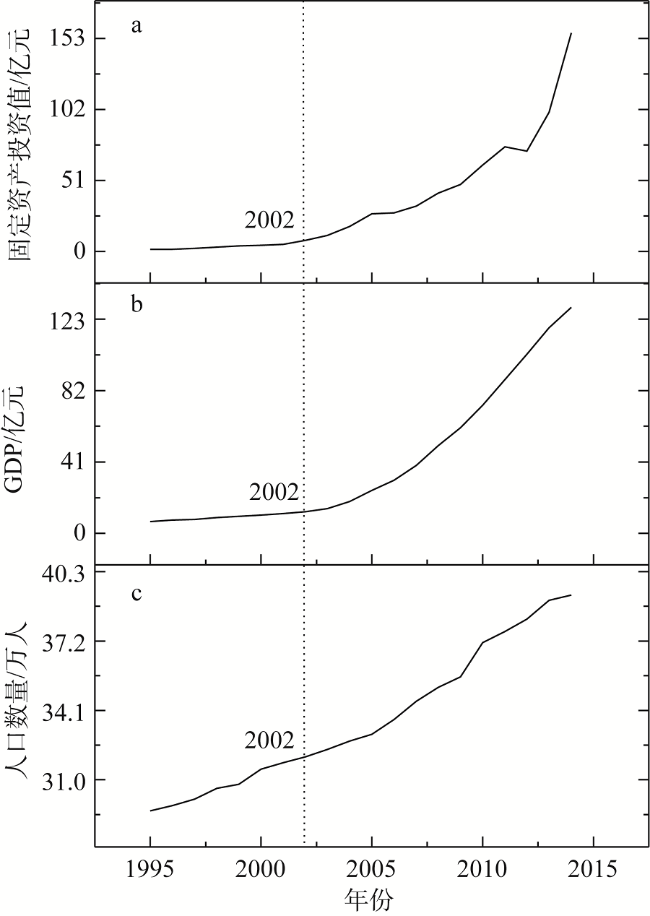
Fig. 6 Economic trends of Mengzi during 1995-2014图6 1995-2014年蒙自经济趋势 |
The authors have declared that no competing interests exist.
| [1] |
|
| [2] |
[
|
| [3] |
[
|
| [4] |
[
|
| [5] |
[
|
| [6] |
[
|
| [7] |
|
| [8] |
|
| [9] |
|
| [10] |
[
|
| [11] |
|
| [12] |
[
|
| [13] |
[
|
| [14] |
[
|
| [15] |
[
|
| [16] |
[
|
| [17] |
[
|
| [18] |
[
|
| [19] |
[
|
| [20] |
|
| [21] |
[
|
| [22] |
[
|
| [23] |
[
|
| [24] |
[
|
| [25] |
[
|
| [26] |
[
|
| [27] |
[
|
| [28] |
[
|
| [29] |
[
|
| [30] |
[
|
| [31] |
[
|
| [32] |
[
|
/
| 〈 |
|
〉 |