
土地整治项目区耕地资源优化配置研究
作者简介:韩博(1995- ),男,河南新乡人,硕士,主要从事土地整治相关研究。E-mail: mg1727028@smail.nju.edu.cn
收稿日期: 2018-08-22
要求修回日期: 2019-02-18
网络出版日期: 2019-04-20
基金资助
国家科技支撑计划项目(2015BAD06B02)
Optimized allocation of cultivated land in land consolidation project area based on multi-objective linear programming
Received date: 2018-08-22
Request revised date: 2019-02-18
Online published: 2019-04-20
Copyright
耕地细碎化会导致农业生产效率降低、土地利用可持续性下降、耕地撂荒增多等多种农业问题,土地整治是当前中国改善耕地细碎化的重要途径之一。为探索适宜的土地整治计量模型以解决耕地资源优化配置问题,基于多目标线性规划,从工程设计、权属调整、地块分配三方面构建土地整治项目区耕地资源优化配置模型,并选取典型土地整治项目进行案例分析。研究结果表明:通过模型优化,案例区农业生产消耗降低了20.41%、地块平均规模增大了53.72%、户均地块数降低了34.92%,平均耕作距离减小了68.17%,可促进耕地细碎化问题的改善,有利于农业生产效率的提升。研究对丰富土地整治规划设计方法,推动耕地细碎化问题解决具有参考和借鉴意义。
韩博 , 金晓斌 , 孙瑞 , 项晓敏 , 刘晶 , 曹帅 , 周寅康 . 土地整治项目区耕地资源优化配置研究[J]. 自然资源学报, 2019 , 34(4) : 718 -731 . DOI: 10.31497/zrzyxb.20190404
Fragmentation of cultivated land will lead to the reduction of agricultural production efficiency, the decline of land use sustainability and the shortage of cultivated land. Land consolidation is one of the important ways to improve the fragmentation of cultivated land in China. In order to explore suitable land consolidation model to solve the problem of optimal allocation of cultivated land resources, this study constructs a model of optimal allocation of cultivated land resources based on multi-objective linear programming model from three aspects: engineering design, ownership adjustment and plots allocation, and selects a typical land consolidation project for case analysis. Then it compares the model optimization and actual land consolidation results with the pre-consolidation from the aspects of agricultural production consumption, improvement of arable land morphology and location, and ownership status. The results show that: (1) Through the optimization of the model, the agricultural cost in the project area, the average number of plots per farmer, and the average cultivation distance decreased by 20.41%, 34.92%, and 68.17%, respectively, while the average size of the plot increased by 53.72%. The fragmentation of cultivated land is reduced and the agricultural production efficiency is improved. However, compared with the typical foreign land consolidation project, there is still much room for improvement in the allocation of cultivated land. (2) The current land consolidation methods have played a positive role in increasing the average size of plots and improving the shape of plots. However, there are still deficiencies in reducing the farming distance of farmers, increasing the adjacency of cultivated roads, and promoting the concentration of cultivated land property rights. (3) Combining land consolidation with land ownership adjustment plays an important role in reducing the agricultural production consumption caused by land fragmentation and inconvenient farming and improving agricultural production efficiency. The research is of significance for enriching planning and designing methods of land consolidation and promoting the solution to the issue of fragmentation of cultivated land.
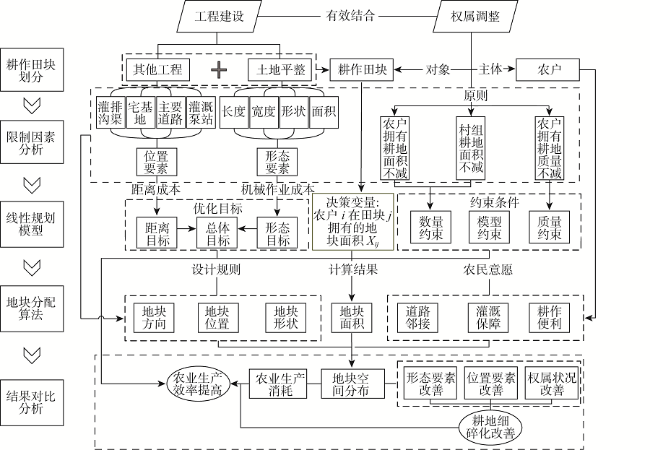
Fig. 1 Technology workflow图1 技术路线 |
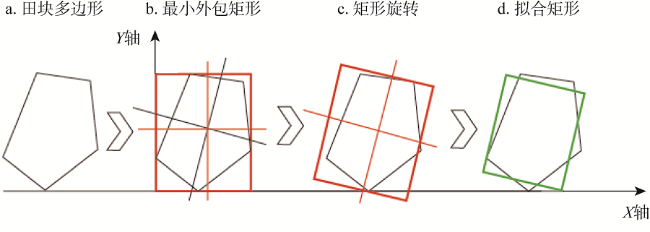
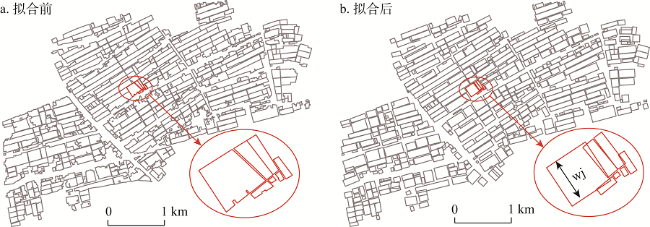
Fig. 2 The scheme of the equivalent rectangle forming progress图2 拟合矩形形成过程示意图 |
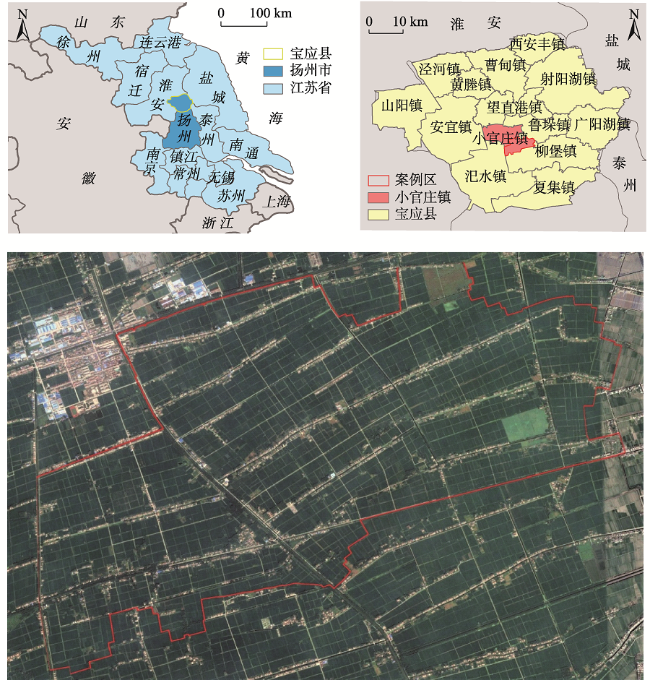
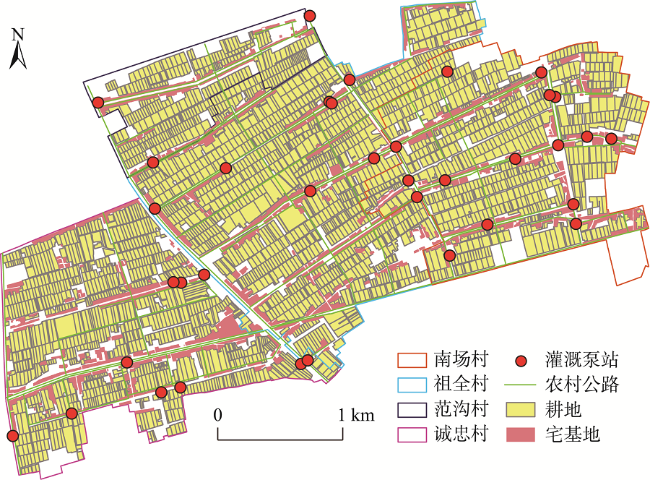
Fig. 3 The location of the project area图3 项目区区位图|||注:遥感影像图来自map.google.com,影像拍摄时间为2017年9月17日,拍摄高度为7.23 km。 |
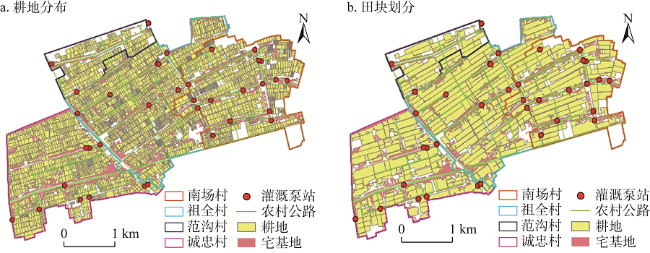
Fig. 4 The distribution of the complex in project area图4 项目区耕作田块分布图 |
Fig. 5 The schematic of the equivalent rectangles of the complx in project area图5 项目区田块拟合示意图 |
Table 1 Multi-objective linear programming model parameters table表1 多目标线性规划模型参数表 |
| 运行参数 | 诚忠村 | 祖全村 | 南场村 | 范沟村 |
|---|---|---|---|---|
| 农户个数/户 | 744 | 863 | 634 | 276 |
| 田块个数/个 | 128 | 129 | 126 | 34 |
| 决策变量数/个 | 95232 | 111327 | 79884 | 9384 |
| 约束条件数/个 | 1616 | 1855 | 1394 | 586 |
| 迭代次数/次 | 8372506 | 10248749 | 8554171 | 13912027 |
| 运行时间/小时 | 81 | 97 | 82 | 104 |
Fig. 6 The result figure of the spatial configuration optimization of plots图6 地块空间配置优化结果图 |
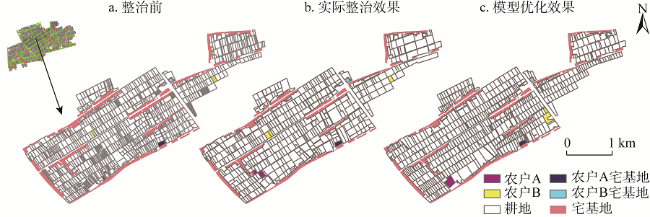
Fig. 7 The space configuration of the plots before and after consolidation图7 整治前后耕地资源空间配置对比图 |
Table 2 Comparison of the cost of cultivation表2 农业生产消耗对比分析 |
| 对象 | 土地整治 | 模型优化 | 国外案例 | |||||
|---|---|---|---|---|---|---|---|---|
| 整治前 | 整治后 | 变化率/% | 整治后 | 变化率/% | 整治前 | 整治后 | 变化率/% | |
| 形状要素消耗/GU | 7212.54 | 6253.78 | -13.29 | 6082.06 | -15.67 | — | — | — |
| 平均形状要素消耗/(GU/hm2) | 6.47 | 5.41 | -16.38 | 5.26 | -18.70 | 2.25 | 1.60 | -28.89 |
| 距离要素消耗/GU | 1512.20 | 1562.87 | 3.35 | 861.73 | -43.01 | — | — | — |
| 平均距离要素消耗/(GU/hm2) | 1.36 | 1.35 | -0.74 | 0.75 | -44.85 | — | — | — |
| 总消耗/GU | 8724.74 | 7816.65 | -10.39 | 6943.79 | -20.41 | — | — | — |
| 平均消耗/(GU/ hm2) | 7.83 | 7.02 | -10.34 | 6.23 | -20.43 | — | — | — |
注:国外案例参考文献[12]。 |
Table 3 Comparison of plots in morphological features before and after consolidation表3 形态要素整治前后变化对比 |
| 对象 | 土地整治 | 模型优化 | |||
|---|---|---|---|---|---|
| 整治前 | 整治后 | 变化率/% | 整治后 | 变化率/% | |
| 地块个数/个 | 4264 | 2998 | -29.69 | 2775 | -34.92 |
| 地块平均规模/m2 | 2539.99 | 3642.84 | 43.42 | 3904.49 | 53.72 |
| 规模地块数/个 | 1202 | 1406 | 16.97 | 1484 | 23.46 |
| 规模地块比例/% | 28.19 | 46.90 | 79.74 | 53.48 | 75.59 |
| 平均地块形状指数 | 1.59 | 1.17 | -26.42 | 1.30 | -18.24 |
| 平均地块周长/m | 225.11 | 265.28 | 17.84 | 247.34 | 9.88 |
| 平均地块长度/m | 82.95 | 91.38 | 10.16 | 98.73 | 19.02 |
| 平均地块宽度/m | 29.61 | 41.26 | 39.34 | 34.94 | 18.00 |
| 平均地块长宽比 | 4.41 | 2.77 | -37.19 | 5.21 | 27.21 |
注:平均地块长度、平均地块宽度、平均地块长宽比按1.3中方法将田块拟合为矩形后计算得到。 |
Table 4 Comparison of plots in location features before and after consolidation表4 位置要素整治前后变化比较 |
| 对象 | 实际土地整治 | 模型优化 | |||
|---|---|---|---|---|---|
| 整治前 | 整治后 | 变化率/% | 整治后 | 变化率/% | |
| 平均运输距离/m | 79.53 | 82.31 | 3.50 | 78.46 | -1.35 |
| 平均灌溉距离/m | 364.59 | 374.63 | 2.75 | 369.05 | 1.22 |
| 临路地块数/个 | 1858 | 1203 | -35.25 | 1459 | -21.47 |
| 临路地块比例/% | 43.57 | 40.13 | -7.90 | 52.58 | 20.68 |
Table 5 Comparison of plots in ownership features before and after consolidation表5 权属状况整治前后变化比较 |
| 对象 | 土地整治 | 模型优化 | |||
|---|---|---|---|---|---|
| 整治前 | 整治后 | 变化率/% | 整治后 | 变化率/% | |
| 农户个数/户 | 2571 | 2571 | 0 | 2571 | 0 |
| 户均地块数/(个/户) | 1.66 | 1.17 | -29.52 | 1.08 | -34.94 |
| 集中经营农户个数/个 | 1393 | 1668 | 19.74 | 2027 | 5.51 |
| 集中经营农户比例/% | 54.18 | 64.88 | 19.75 | 78.84 | 45.51 |
| 平均耕作距离/m | 446.57 | 462.09 | 3.48 | 142.14 | -68.17 |
| 累计耕作距离/km | 1904.17 | 1385.35 | -27.24 | 394.44 | -79.29 |
The authors have declared that no competing interests exist.
| [1] |
[
|
| [2] |
|
| [3] |
[
|
| [4] |
|
| [5] |
[
|
| [6] |
|
| [7] |
|
| [8] |
|
| [9] |
|
| [10] |
|
| [11] |
[
|
| [12] |
|
| [13] |
|
| [14] |
[
|
| [15] |
[
|
| [16] |
|
| [17] |
[
|
| [18] |
[
|
| [19] |
[
|
| [20] |
[
|
| [21] |
[
|
| [22] |
[
|
| [23] |
|
| [24] |
|
| [25] |
|
| [26] |
|
| [27] |
|
| [28] |
[
|
| [29] |
[
|
| [30] |
[
|
| [31] |
[
|
| [32] |
|
| [33] |
[
|
| [34] |
|
| [35] |
|
| [36] |
|
/
| 〈 |
|
〉 |