
1995-2015年江苏省土地利用功能转型特征及其协调性分析
作者简介:张晓琳(1994- ),女,河北邢台人,硕士,主要从事为土地利用规划研究。E-mail: 2933793970@qq.com
收稿日期: 2018-11-12
要求修回日期: 2019-02-20
网络出版日期: 2019-04-20
基金资助
国家科技支撑计划项目(2015BAD06B02)
Spatial-temporal characteristics and coordination status of the land use function transition in Jiangsu province from 1995 to 2015
Received date: 2018-11-12
Request revised date: 2019-02-20
Online published: 2019-04-20
Copyright
土地利用功能转型可实现土地利用功能协调,是实施区域可持续发展的重要路径。从功能协调角度构建土地利用功能转型分析框架,利用江苏省1995年、2000年、2005年、2010年和2015年5期遥感影像及相关资源利用和社会经济数据,构建三级土地利用功能评价体系,以县域为评价单元,通过三角模型和空间相关分析等方法,定量解析江苏省土地利用功能时空演变特征及其与土地可持续利用目标的协调状况。研究结果显示:(1)研究期内,江苏省土地利用功能总水平提升减慢,其中生产、生活功能不同程度提升,生态功能明显下降。(2)生产、生活功能空间集聚不突出,生态功能的热点、冷点区域呈“Y”型集聚分布。(3)不同功能区功能协调性态势不一,重点开发区和限制开发区可持续发展态势总体良好,优化开发区可持续发展程度较弱并持续恶化。建议江苏省在落实发展蓝图和空间规划的过程中,应优先推进苏南现代化示范区建设,重点实施重点开发区生活功能转型、Ⅰ类限制开发区生产功能转型策略,并严格落实禁止开发区的生态保护责任等差别化管理策略。
张晓琳 , 金晓斌 , 范业婷 , 刘晶 , 单薇 , 周寅康 . 1995-2015年江苏省土地利用功能转型特征及其协调性分析[J]. 自然资源学报, 2019 , 34(4) : 689 -706 . DOI: 10.31497/zrzyxb.20190402
The land use function transition is an important measure to promote the coordination of land use functions and achieve sustainable regional development. This paper constructs an analysis framework for land use function transition based on sustainable development from the perspective of functional coordination, and uses the five phases of remote sensing images of Jiangsu province in 1995, 2000, 2005, 2010 and 2015, as well as related resource utilization and socio-economic data to construct the three level evaluation system of land use function. Taking the county as an evaluation unit, through triangle model and spatial correlation analysis, the spatial-temporal evolution characteristics of land use functions are quantitatively analyzed, and the coordination status of land use functions is proposed for sustainable land use in Jiangsu province. This paper has obtained the following main findings: (1) During the research period, the overall level of land use function in Jiangsu province has increased at a slower pace. The production and living functions have enhanced in different degrees, and the ecological function has significantly been reduced. (2) The spatial aggregation of production and living functions of land use in this province has not been obvious, and the areas of ecological functional hot spots and cold spots have a "Y"-shaped pattern of agglomeration distribution. (3) The sustainable development of different functional areas has not been the same. The sustainable development of key development zones and restricted development zones has been generally good. The sustainable development of optimizing development zones has been weak and continued to deteriorate. In the process of implementing development plans and space planning, we suggest that priority should be given to construct the modern demonstrative region in Southern Jiangsu, the key development zones should be focused on the living function transition, the restricted development zones (I type) should be focused on the production function transition, and the forbidden development zones should be implemented strictly to protect the environment.
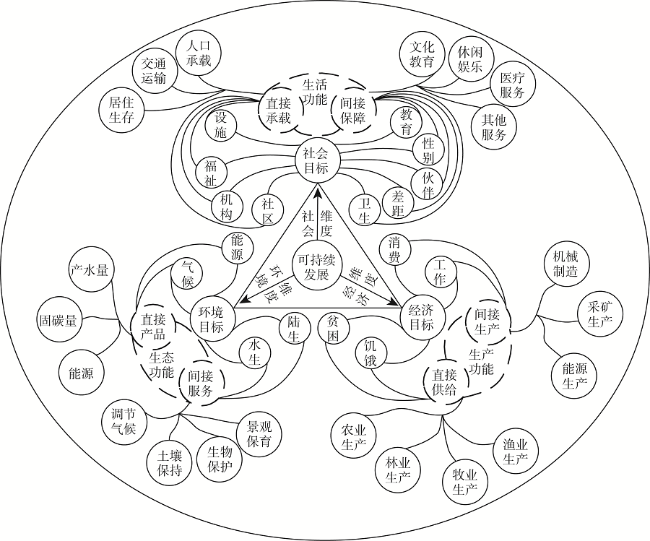
Fig. 1 Analysis of land use functions图1 土地利用功能解析 |
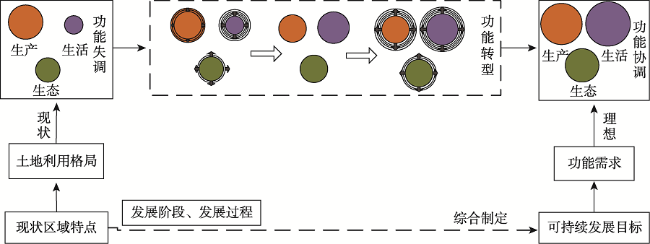
Fig. 2 The coordination process of land use function图2 土地利用功能协调过程 |
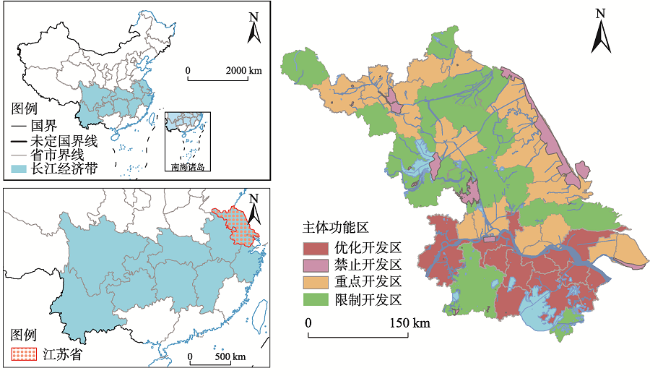
Fig. 3 Location of the study area图3 研究区位置示意图|||注:本图基于国家测绘地理信息局标准地图服务网站下载审图号为GS(2016)2884号的标准地图制作,底图无修改。 |
Table 1 Data sources and description表1 数据来源及说明 |
| 数据类型 | 数据产品 | 来源 | 空间分辨率 |
|---|---|---|---|
| 土地利用数据 | 土地利用现状遥感监测数据 | 中国科学院资源环境科学数据中心 | 1:10万 |
| 遥感影像数据 | Landsat 4 TM | 地理空间数据云 | 30 m |
| Landsat 8 OLI_TRIS | |||
| 社会经济数据 | 江苏省省统计年鉴 | 江苏省统计局 | 县级 |
| 江苏省环境保护区 | 长三角(江苏省)1:25万环境保护区空间数据(2013年) | 国家地球系统科学数据共享服务平台 | 1:25万 |
| DEM | ASTER GDEM V2版 | 地理空间数据云 | 30 m |
| NDVI | MYDND1M 中国500M NDVI月合成产品 | 地理空间数据云 | 500 m |
| NPP | MOD17A3H | http://www.noaa.gov/ | 1 km |
| 土壤数据 | 全国第二次土壤普查数据集 | 中国土壤数据库 | 1:100万 |
| 降水量 | 江苏农业基本气象资料月值、年值数据集 | 中国气象局气象数据中心 | 4 km |
| 蒸散量 | MOD16A3H | http://www.noaa.gov/ | 500 m |
| 叶面积指数 | MOD15A2H | http://www.noaa.gov/ | 1 km |
| 根系深度 | —— | 文献[32] | 土地利用/ |
| 覆盖类型 |
注:部分年代缺失的地区数据,由相邻年份插值获得。 |
Table 2 Classification system and characterized indexes description of land use functions表2 土地利用功能分类体系及表征指标说明 |
| 目标层 | 准则层 | 解释 | 表征指标 | 单位 | 量化方法 | 目标值 | 指标性质 |
|---|---|---|---|---|---|---|---|
| 生产功能(经济产值) | 农产品供给功能 | 生产及提供农产品的能力 | 农业产值 | 亿元 | 统计年鉴获得 | 82.13 | + |
| 工矿生产功能 | 生产及提供工业产品的能力 | 工业产值 | 亿元 | 统计年鉴获得 | 3076.52 | + | |
| 林产品供给功能 | 生产及提供林产品的能力 | 林业产值 | 亿元 | 统计年鉴获得 | 4.25 | + | |
| 生活功能 (社会效益) | 居住承载功能 | 为人类需要提供居住承载的能力 | 人口密度 | 人/km2 | 参考文献[20] | 1067.78 | + |
| 交通便利功能 | 为人的出行、货物运输提供社会保障的能力 | 万人货运量 | 万t | 复合指标法 参考文献[16] | 3857.88 | + | |
| 万人客运量 | 万人 | 4067.44 | + | ||||
| 休闲服务功能 | 为人类生活需要提供休闲服务的能力 | 第三产业人员比例 | % | 统计年鉴获得 | 53.6 | + | |
| 生态功能 (生态服务) | 水源涵养功能 | 水资源供给服务的能力 | 产水量 | mm/km2 | InVEST模型参考文献[32] | 746.73 | + |
| 土壤保持功能 | 土壤侵蚀控制的 能力 | 土壤侵蚀量 | t/km2 | RUSLE模型参考文献[34] | 482.34 | – | |
| 气候调节功能 | 缓解气候变化的 能力 | 固碳量 | g/m2 | 参考文献[35] | 233.91 | + | |
| 生物保护功能 | 生物多样性保护的能力 | 生境质量 | — | InVEST模型参考文献[36] | 0.24 | + |
注:计算生态服务功能时,将研究区划分为1 km×1 km栅格,并将所有指标统一到该空间尺度下。 |
Fig. 4 Status and change of land use function图4 土地利用系统功能状态及变化 |
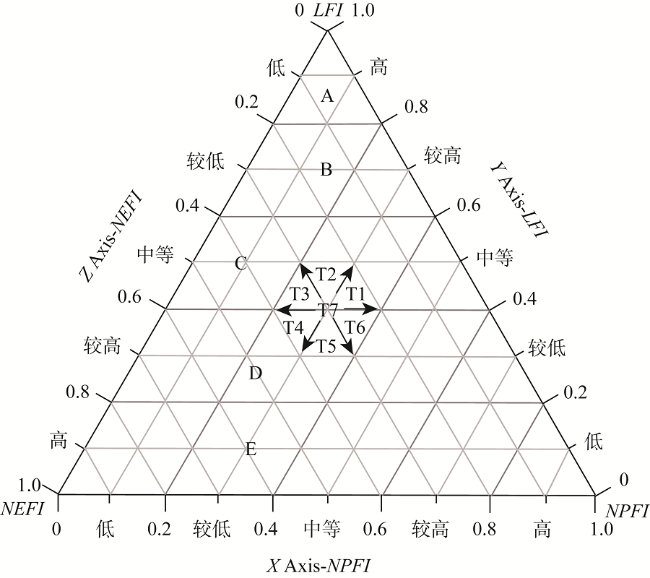
Table 3 Status of land use multi-functionalization of a land use system表3 土地利用系统功能状态 |
| 区域 | 指标数值范围 | 功能水平 | ||
|---|---|---|---|---|
| LFI | NPFI | NEFI | ||
| A | 0.8~1.0 | 0~0.2 | 0~0.2 | 高水平 |
| B | 0.6~0.8 | 0~0.4 | 0~0.4 | 中高水平 |
| C | 0.4~0.6 | 0~0.6 | 0~0.6 | 中水平 |
| D | 0.2~0.4 | 0~0.8 | 0~0.8 | 中低水平 |
| E | 0~0.2 | 0~1.0 | 0~1.0 | 低水平 |
Table 4 Analysis of land use functions表4 土地利用各功能分析 |
| 指标 | 1995年 | 2000年 | 2005年 | 2010年 | 2015年 | |||
|---|---|---|---|---|---|---|---|---|
| 功能实现率 | 0.262 | 0.359 | 0.445 | 0.558 | 0.568 | |||
| 功能变化动态度/% | 37.08 | 23.84 | 25.44 | 1.81 | ||||
| 功能标准差 | 0.024 | 0.019 | 0.021 | 0.017 | 0.049 | |||
| 功能变化优势度 | 0.254 | 0.667 | 0.381 | 0.152 | ||||
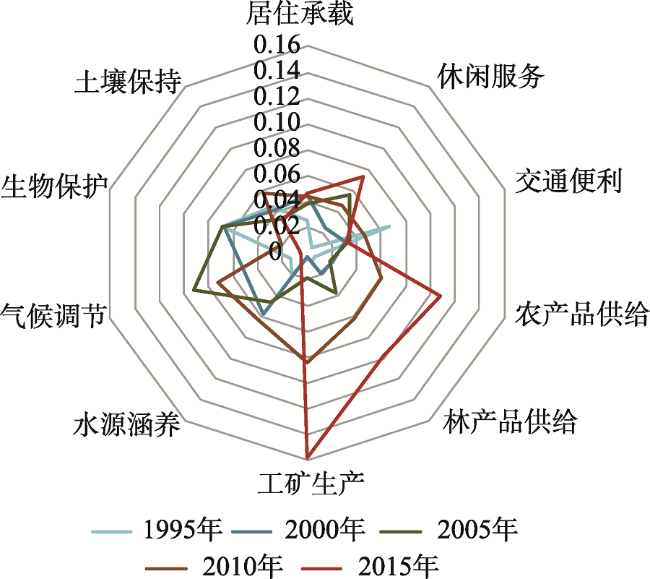
Fig. 5 The assessment of land use functions in Jiangsu province图5 江苏省土地利用多功能评价 |
Fig. 6 Status and change of land use functions in Jiangsu province图6 江苏省土地利用功能状态及变化 |
Table 5 The results of Global Moran's I表5 全局空间自相关计算结果 |
| 功能 | 年份 | ||||
|---|---|---|---|---|---|
| 1995 | 2000 | 2005 | 2010 | 2015 | |
| 生产功能 | -0.0497 | -0.0009 | -0.0433 | -0.0899 | 0.1411 |
| 生活功能 | 0.0995 | 0.2398*** | 0.1143 | 0.1409 | 0.2193** |
| 生态功能 | 0.3492*** | 0.3852*** | 0.4007*** | 0.4201*** | 0.3935*** |
注:**表示0.001<P<0.01,***表示P<0.001。 |
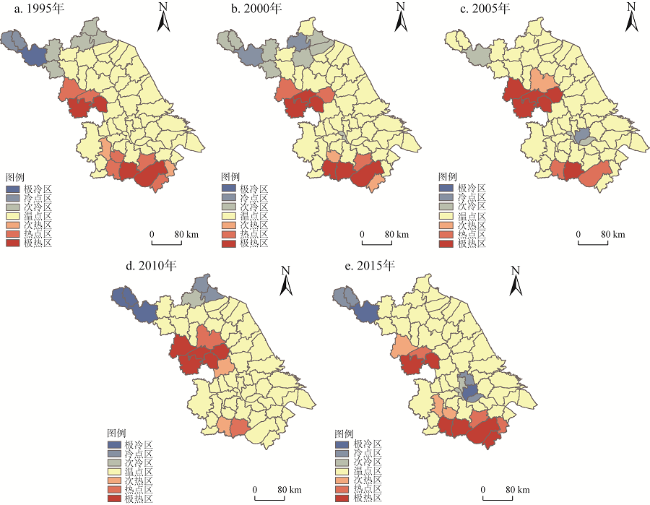
Fig.7 Evolution of spatial pattern of land use ecological function in Jiangsu province图7 江苏省土地利用生态功能空间格局演化 |
Table 6 The results of calculation of relevant indicators in the major function-oriented zone表6 主体功能区相关指标计算结果 |
| 指标 | 功能区 | ||||
|---|---|---|---|---|---|
| 优化开发区 | 重点开发区 | Ⅰ类限制开发区 | Ⅱ类限制开发区 | ||
| 功能 水平 | 生产功能 | [0.06, 0.27] | [0.07, 0.34] | [0.02, 0.11] | [0, 0.04] |
| 生活功能 | [0.41, 0.99] | [0.08, 0.31] | [0.07, 0.12] | [0, 0.04] | |
| 生态功能 | [0.30, 0.39] | [0.31, 0.39] | [0.32, 0.45] | [0.48, 0.75] | |
| 功能 权重 | 生产功能 | 1/10 | 2/5 | 2/5 | 1/10 |
| 生活功能 | 3/5 | 2/5 | 1/5 | 1/10 | |
| 生态功能 | 3/10 | 1/5 | 2/5 | 4/5 | |
| C | 1 | 1 | 1 | 1 | |
| T | [0.558, 0.738] | [0.202, 0.338] | [0.182, 0.248] | [0.111, 0.608] | |
| D | [0.747, 0.859] | [0.449, 0.581] | [0.426, 0.498] | [0.333, 0.780] | |
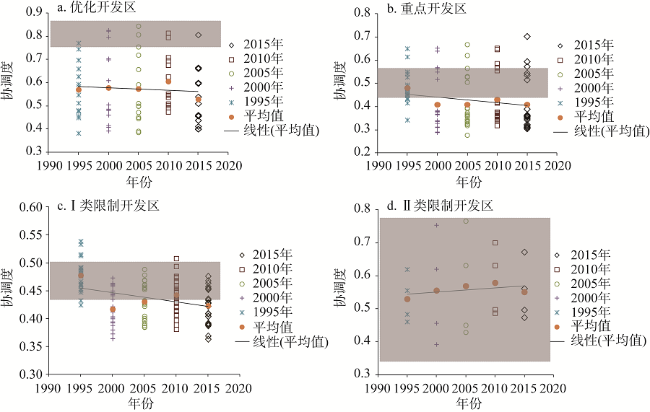
Fig. 8 Evolution of land use functional coordination in Jiangsu province图8 江苏省土地利用功能协调演变过程 |
The authors have declared that no competing interests exist.
| [1] |
|
| [2] |
[
|
| [3] |
[
|
| [4] |
[
|
| [5] |
[
|
| [6] |
|
| [7] |
[
|
| [8] |
[
|
| [9] |
[
|
| [10] |
[
|
| [11] |
[
|
| [12] |
|
| [13] |
[
|
| [14] |
[
|
| [15] |
|
| [16] |
[
|
| [17] |
[
|
| [18] |
[
|
| [19] |
[
|
| [20] |
[
|
| [21] |
[
|
| [22] |
[
|
| [23] |
[
|
| [24] |
[
|
| [25] |
|
| [26] |
[
|
| [27] |
|
| [28] |
[
|
| [29] |
[
|
| [30] |
[
|
| [31] |
[
|
| [32] |
[
|
| [33] |
[
|
| [34] |
[
|
| [35] |
[
|
| [36] |
[
|
| [37] |
|
| [38] |
|
| [39] |
|
| [40] |
|
| [41] |
[
|
/
| 〈 |
|
〉 |
