
青藏高原粮食生产、消费及安全风险格局变化
作者简介:段健(1986- ),女,湖南怀化人,博士研究生,研究方向为区域可持续发展。E-mail: duanj.16b@igsnrr.ac.cn
收稿日期: 2018-10-09
要求修回日期: 2019-02-01
网络出版日期: 2019-04-20
基金资助
中国科学院战略性先导科技专项(A类)(XDA20020301)
中国科学院科技服务网络计划(STS计划)
Spatial patterns and their changes of grain production, grain consumption and grain security in the Tibetan Plateau
Received date: 2018-10-09
Request revised date: 2019-02-01
Online published: 2019-04-20
Copyright
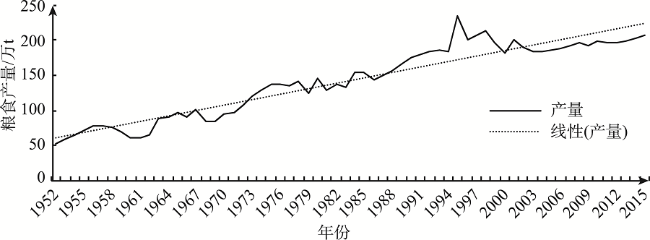
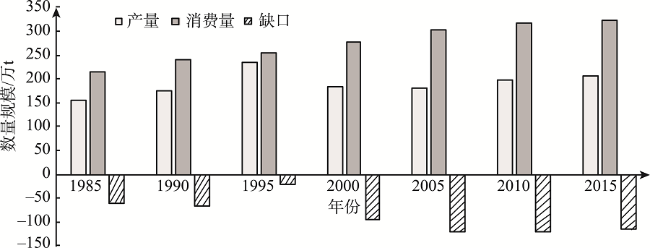
青藏高原是中国粮食短缺地区之一,提高其粮食自给能力和确保粮食安全一直受到中央和地方政府的高度重视。在修订牧业区和半农半牧地区人均粮食消费需求量标准的基础上,利用1985-2015年青藏高原县级行政单元粮食产量和消费数据,采用波动系数法、分级法、重心模型以及粮食短缺指数模型,分析青藏高原粮食生产和消费的时空变化特征,并评估114个县市的粮食安全风险状况。结果表明:青藏高原粮食生产与消费空间分布不均衡,粮食生产呈环形分布在青藏高原东部湟黄谷地、藏东和藏南沿江河谷地带,中部和西部粮食产量较低,粮食消费呈东高西低格局;本地粮食生产不能满足居民消费需求,区域粮食缺口量达21.04万~121.69万t,相当于粮食消费需求的8.22%~40.11%,考虑旅游人口的影响,2015年区域粮食缺口达132.92万t;青藏高原粮食安全风险较高的地区广泛分布在藏北高原、青南高原、祁连山地以及城市化水平较高的拉萨市辖区和西宁市辖区,旅游业发展对林芝市的粮食安全风险影响显著;单纯依靠粮食增产不能解决区域粮食问题,建立完善的粮食储备和交通物流体系、加强与内地及周边国家的粮食贸易合作,是保障青藏高原粮食安全的关键。
段健 , 徐勇 , 孙晓一 . 青藏高原粮食生产、消费及安全风险格局变化[J]. 自然资源学报, 2019 , 34(4) : 673 -688 . DOI: 10.31497/zrzyxb.20190401
The problem of grain shortages has long plagued the Tibetan Plateau, therefore both the state and the local government are scaling up efforts to achieve grain self-sufficiency and grain security in this region. Meanwhile, many researchers devoted themselves to study the grain security issues to provide rational advices. Here in this paper, we intended to analyze the temporal and spatial characteristics of grain production and consumption in the Tibetan Plateau and then evaluate the risk status of grain security in 114 counties. First, we revised the standards of per capita grain consumption demand in pasturing area and farming-pastoral region. Then, on this basis, we analyzed the corresponding data of the 114 counties during 1985-2015 by applying the fluctuation coefficient method, classification method, barycenter model and the index model of grain shortages. Analytical results showed that there was a non-uniform geographical distribution of grain production and consumption, moreover, the holistic status of grain security in the Tibetan Plateau was not optimistic. (1) The production of grain increased in fluctuation and the consumption of grain grew steadily, the local grain production could not meet the consumption demand, and the deficit amounts were between 0.21 and 1.22 million tons annually, which accounted for between 8.22% and 40.11% of the grain consumption. The gap between grain production and consumption including tourists increased to 1.33 million tons in 2015. (2) The spatial distributions of grain production and grain consumption in the Tibetan Plateau were imbalanced, the grain yields in Huang-Huang valley and the valley along the Yarlung Zangbo River were higher, while the yields distributed in the central and western parts of the plateau were lower. Affected by population, city, and traffic distribution, the grain consumption was high in the eastern part and low in the western. (3) The spatial patterns of grain security in the Tibetan Plateau in 2015 showed that the higher-risk types involved 42 counties with a population of 2.92 million, and they were widely distributed in western Tibet, northern Tibet, southern Qinghai, Qilian Mountains, as well as in municipal districts of cities of Lhasa and Xining; compared to 1985, the risks of grain security on the midstream and downstream of Yarlung Zangbo River and southeastern Qinghai province were mitigated, while those in western Ngari and northeastern Qinghai were intensified. (4) The tourists increased the risks of grain security in Lhasa, Nyingchi, Shannan, Shigatse, Haidong and Hainan cities, and the negative influence of tourist on Linzhi city was most significant. (5) Production increase alone cannot solve the problem of grain shortage, so it is urgent for the Tibetan Plateau to improve the grain reserves, transportation facilities and expand the grain trade with other regions to achieve regional grain security.
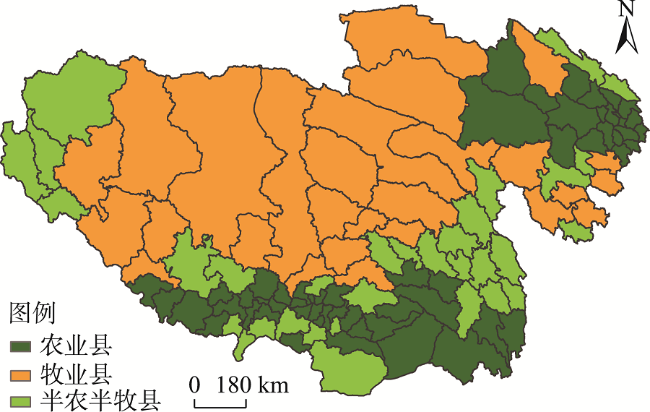
Fig. 1 Location and distribution of agricultural areas in the Tibetan Plateau图1 青藏高原位置与农业地域类型分布 |
Fig. 2 Changes in grain yield in the Tibetan Plateau between 1952 and 2015图2 1952-2015年青藏高原粮食产量变化 |
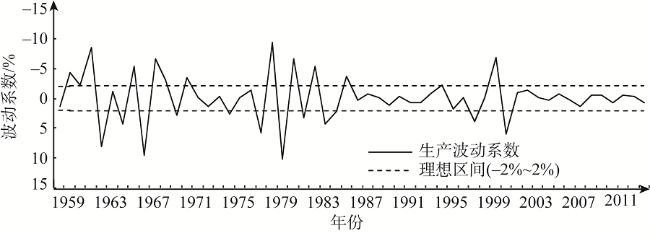
Fig. 3 Fluctuations in grain production in the Tibetan Plateau between 1959 and 2014图3 1959-2014年青藏高原粮食生产波动特征 |
Fig. 4 Changes in grain production, grain consumption and the balance between them in the Tibetan Plateau between 1985 and 2015图4 1985-2015年青藏高原粮食产消平衡及变化 |
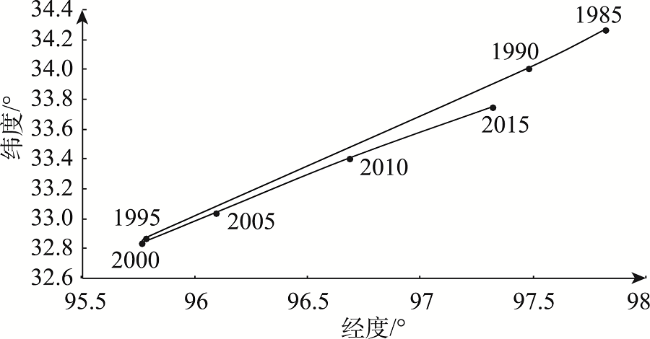
Fig. 5 Tracks of grain production gravity center in the Tibetan Plateau between 1985 and 2015图5 1985-2015年青藏高原粮食生产重心迁移轨迹 |
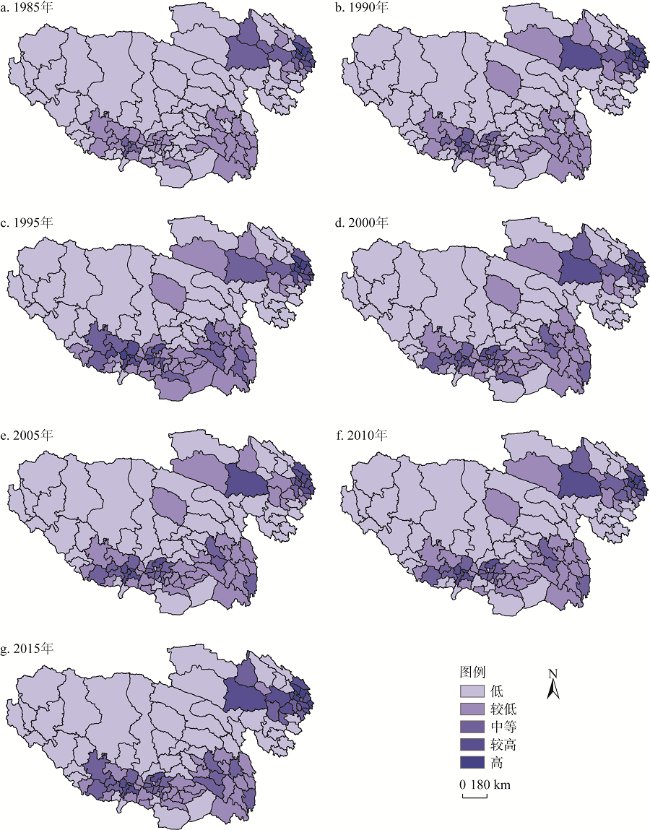
Fig. 6 Spatial patterns and their changes of grain production in the Tibetan Plateau between 1985 and 2015图6 1985-2015年青藏高原粮食生产格局及变化 |
Table 1 Classification and types of grain production in the Tibetan Plateau表1 青藏高原粮食产量分级类型及变化 |
| 年份 | 1985年 | 2015年 | ||||||||||||||
|---|---|---|---|---|---|---|---|---|---|---|---|---|---|---|---|---|
| 指标 | 县级单元 | 土地 | 涉及人口 | 县级单元 | 土地 | 涉及人口 | ||||||||||
| 数量/个 | 比例 /% | 面积 /万km2 | 比例 /% | 数量/万 | 比例 /% | 数量 /个 | 比例 /% | 面积 /万km2 | 比例 /% | 数量 /万 | 比例 /% | |||||
| 高 | 3 | 2.63 | 0.86 | 0.46 | 103.60 | 17.20 | 4 | 3.51 | 1.05 | 0.55 | 177.00 | 19.63 | ||||
| 较高 | 3 | 2.63 | 0.74 | 0.39 | 72.28 | 12.01 | 12 | 10.53 | 10.65 | 5.61 | 162.96 | 18.08 | ||||
| 中等 | 12 | 10.53 | 12.65 | 6.66 | 94.88 | 15.75 | 24 | 21.05 | 18.68 | 9.84 | 160.59 | 17.81 | ||||
| 较低 | 38 | 33.33 | 29.84 | 15.71 | 192.98 | 32.05 | 28 | 24.56 | 23.10 | 12.17 | 118.53 | 13.15 | ||||
| 低 | 58 | 50.88 | 145.82 | 76.78 | 138.47 | 22.99 | 46 | 40.35 | 136.43 | 71.84 | 282.44 | 31.33 | ||||
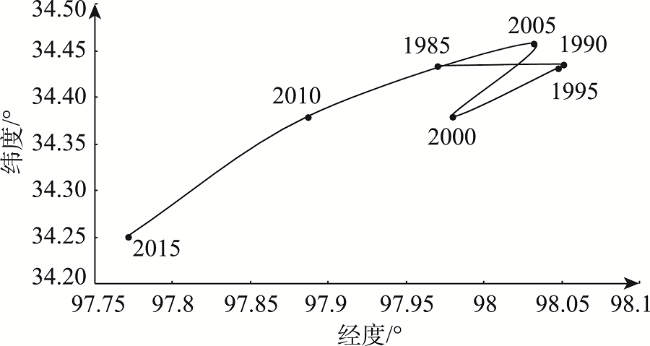
Fig. 7 Tracks of grain consumption gravity center in the Tibetan Plateau between 1985 and 2015图7 1985-2015年青藏高原粮食消费重心迁移轨迹 |
Table 2 Classification and types of grain consumption in the Tibetan Plateau表2 青藏高原粮食消费分级类型及变化 |
| 年份 | 1985年 | 2015年 | ||||||||||||||
|---|---|---|---|---|---|---|---|---|---|---|---|---|---|---|---|---|
| 指标 | 县级单元 | 土地 | 涉及人口 | 县级单元 | 土地 | 涉及人口 | ||||||||||
| 数量/个 | 比例 /% | 面积 /万km2 | 比例 /% | 数量 /万 | 比例 /% | 数量 /个 | 比例 /% | 面积 /万km2 | 比例 /% | 数量 /万 | 比例 /% | |||||
| 高 | 6 | 5.26 | 1.35 | 0.71 | 215.46 | 35.78 | 8 | 7.02 | 1.68 | 0.89 | 350.86 | 38.92 | ||||
| 较高 | 5 | 4.39 | 4.42 | 2.33 | 75.78 | 12.58 | 9 | 7.89 | 4.44 | 2.34 | 114.01 | 12.65 | ||||
| 中等 | 14 | 12.28 | 14.62 | 7.70 | 97.11 | 16.13 | 30 | 26.32 | 41.48 | 21.84 | 216.39 | 24.00 | ||||
| 较低 | 40 | 35.09 | 52.65 | 27.72 | 142.50 | 23.66 | 43 | 37.72 | 59.87 | 31.53 | 171.50 | 19.02 | ||||
| 低 | 49 | 42.98 | 116.87 | 61.54 | 71.37 | 11.85 | 24 | 21.05 | 82.44 | 43.41 | 48.75 | 5.41 | ||||
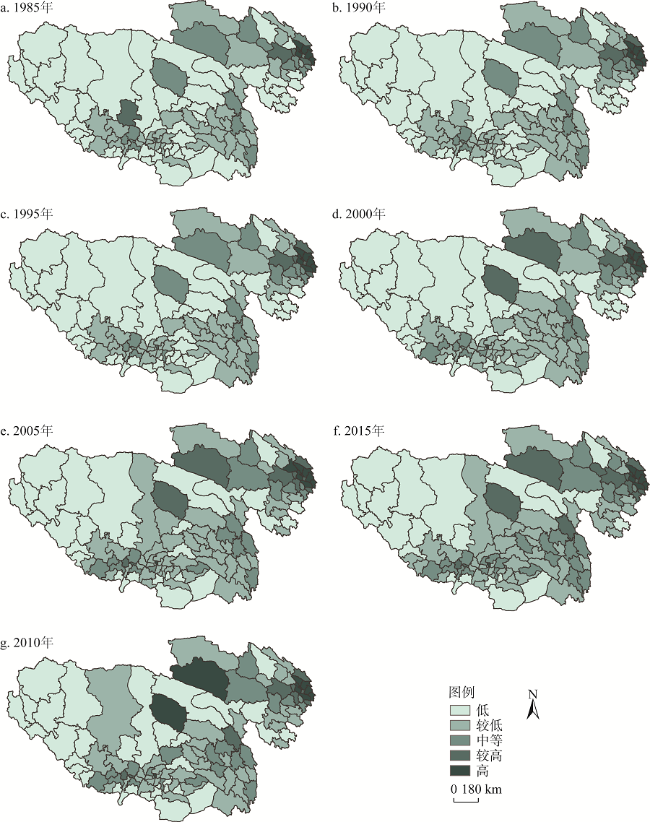
Fig. 8 Spatial patterns and their changes of grain consumption in the Tibetan Plateau between 1985 and 2015图8 1985-2015年青藏高原粮食消费格局及变化 |
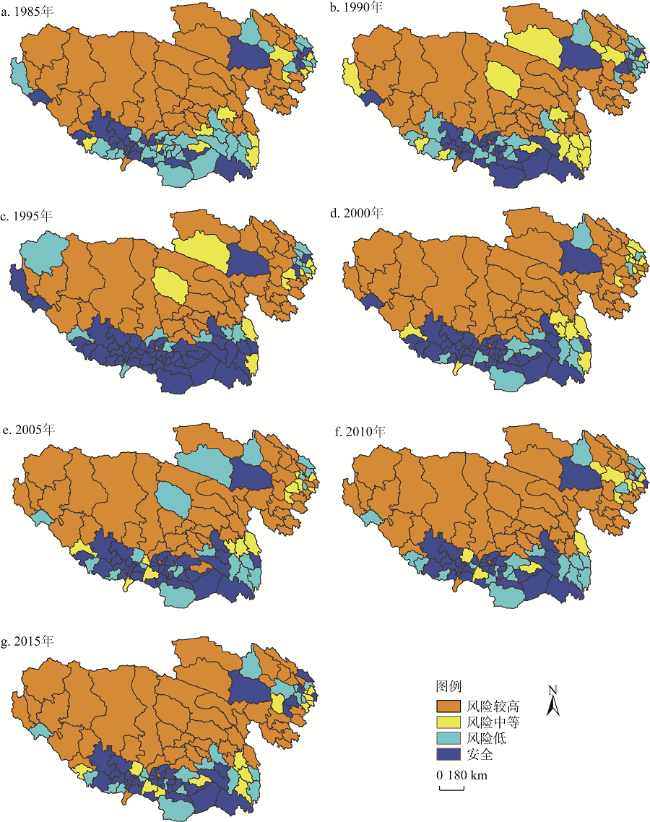
Fig. 9 Spatial patterns and their changes of grain security in the Tibetan Plateau between 1985 and 2015图9 1985年-2015年青藏高原粮食安全空间格局及变化 |
Table 3 Classification and types of the risks of grain security in the Tibetan Plateau表3 青藏高原粮食安全风险等级类型及变化 |
| 年份 | 1985年 | 2015年 | ||||||||||||||
|---|---|---|---|---|---|---|---|---|---|---|---|---|---|---|---|---|
| 指标 | 县级单元 | 土地 | 涉及人口 | 县级单元 | 土地 | 涉及人口 | ||||||||||
| 数量/个 | 比例 /% | 面积 /万km2 | 比例 /% | 数量 /万 | 比例 /% | 数量/个 | 比例 /% | 面积 /万km2 | 比例 /% | 数量 /万 | 比例 /% | |||||
| 风险 较高 | 38 | 33.33 | 105.15 | 55.37 | 179.84 | 29.86 | 42 | 36.84 | 128.72 | 67.78 | 292.95 | 32.50 | ||||
| 风险 中等 | 18 | 15.79 | 32.54 | 17.13 | 94.12 | 15.63 | 18 | 15.79 | 12.07 | 6.36 | 218.55 | 24.24 | ||||
| 风险低 | 40 | 35.09 | 37.94 | 19.98 | 244.67 | 40.63 | 30 | 26.32 | 29.31 | 15.43 | 283.18 | 31.41 | ||||
| 安全 | 18 | 15.79 | 14.30 | 7.53 | 83.59 | 13.88 | 24 | 21.05 | 19.81 | 10.43 | 106.83 | 11.85 | ||||
Table 4 The impact of tourists on the grain security of the Tibetan Plateau in 2015表4 2015年旅游人口对青藏高原粮食安全格局的影响 |
| 地级市单元 | 粮食产量/万t | 常住人口/万 | 旅游人次/万 | 逗留时间/天 | 粮食安全指数 | 修正后粮食安全指数 |
|---|---|---|---|---|---|---|
| 拉萨市 | 18.22 | 52.98 | 1179.00 | 3 | -0.06 | -0.18 |
| 昌都市 | 18.40 | 77.00 | 146.03 | 2 | -0.28 | -0.28 |
| 山南地区 | 15.72 | 37.00 | 234.98 | 1.5 | 0.14 | 0.10 |
| 日喀则市 | 38.28 | 78.00 | 320.89 | 1.5 | 0.33 | 0.30 |
| 那曲地区 | 1.28 | 46.00 | 100.00 | 1.5 | -0.88 | -0.86 |
| 阿里地区 | 0.53 | 11.00 | 37.97 | 1.5 | -0.81 | -0.78 |
| 林芝市 | 8.21 | 19.50 | 351.72 | 2 | 0.09 | -0.01 |
| 西宁市 | 22.27 | 201.36 | 1606.53 | 3 | -0.72 | -0.68 |
| 海东市 | 54.35 | 170.02 | 836.00 | 2 | -0.20 | -0.21 |
| 海北州 | 5.23 | 29.70 | 636.00 | 2 | -0.46 | -0.45 |
| 黄南州 | 2.94 | 27.06 | 344.29 | 1.5 | -0.66 | -0.62 |
| 海南州 | 14.67 | 46.69 | 476.00 | 2 | -0.19 | -0.21 |
| 果洛州 | 0.20 | 19.72 | 36.50 | 1 | -0.96 | -0.96 |
| 玉树州 | 0.30 | 39.19 | 46.40 | 1 | -0.97 | -0.94 |
| 海西州 | 6.63 | 46.31 | 746.30 | 2 | -0.53 | -0.50 |
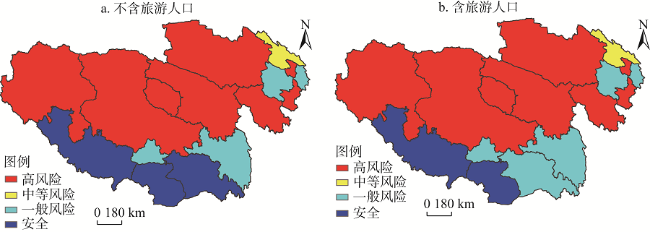
Fig. 10 Comparison on spatial patterns of grain security in the Tibetan Plateau in 2015图10 2015年青藏高原粮食安全格局对比图 |
The authors have declared that no competing interests exist.
| [1] |
[
|
| [2] |
[
|
| [3] |
[
|
| [4] |
[
|
| [5] |
[
|
| [6] |
[
|
| [7] |
[
|
| [8] |
[
|
| [9] |
[
|
| [10] |
[
|
| [11] |
[
|
| [12] |
[
|
| [13] |
[
|
| [14] |
[
|
| [15] |
[
|
| [16] |
[
|
| [17] |
[
|
| [18] |
[
|
| [19] |
|
| [20] |
|
| [21] |
|
| [22] |
中国农业科学院. 人均400公斤粮食必不可少. 中国农业科学, 1986, 19(5): 1-7.
[Chinese Academy of Agricultural Sciences. 400 kilogrammes of grain per capital are essential to China. Scientia Agricultura Sinica, 1986, 19(5): 1-7.]
|
| [23] |
[
|
/
| 〈 |
|
〉 |