
石漠化治理区土地利用变化安全性评价——以花江、红枫湖、鸭池石漠化治理区为例
作者简介:罗娅(1979- ),女,贵州毕节人,教授,研究方向为土地利用与水土流失治理研究。E-mail: luoya2002@163.com
收稿日期: 2018-09-05
要求修回日期: 2018-12-13
网络出版日期: 2019-03-28
基金资助
国家十三五重点研发计划课题(2016YFC0502607)
贵州省普通高等学校科技拔尖人才支持计划
Evaluation on security of land use change in rocky desertification control areas: Taking Huajiang, Hongfenghu and Yachi as examples
Received date: 2018-09-05
Request revised date: 2018-12-13
Online published: 2019-03-28
Copyright
土地利用变化的安全性是可持续土地利用的重要评价标准之一。以花江、红枫湖、鸭池三个石漠化治理区为例,运用“纵横向”拉开档次法,对石漠化治理区土地利用变化的安全性开展评价,为评估石漠化治理区土地利用变化效应和改进石漠化治理区的土地利用方式提供借鉴。结果表明:(1)石漠化治理区的土地利用变化明显。花江、红枫湖、鸭池三个石漠化治理区的土地利用变化面积比例分别为2.85%、3.34%和37.88%,表现为林地和建设用地增加,耕地和未利用地减少。(2)土地利用变化对不同治理区的综合安全性和生态、经济、社会安全性的影响不同。花江治理区和红枫湖治理区的综合安全性分别提高1.44%和0.46%;鸭池治理区的综合安全性下降了1.9%。花江治理区的生态、社会安全性有所提升,经济安全性有所下降;红枫湖治理区的生态安全性有所提升,经济安全性变化不明显,社会安全性有小幅下降;鸭池治理区的生态安全性有明显下降,经济安全性有小幅提升,社会安全性有小幅下降。(3)各治理区的生态、经济、社会安全性对土地利用变化的敏感性存在差异,其中生态安全性对土地利用变化最敏感。揭示石漠化治理区土地利用变化对生态安全性的影响最明显。在后续石漠化治理和土地利用规划中,应重点关注土地利用变化对区域生态安全的影响。
关键词: 安全性; 土地利用变化; 石漠化; “纵横向”拉开档次法
罗娅 , 熊康宁 , 李永垚 , 盈斌 , 韦清章 . 石漠化治理区土地利用变化安全性评价——以花江、红枫湖、鸭池石漠化治理区为例[J]. 自然资源学报, 2019 , 34(3) : 600 -612 . DOI: 10.31497/zrzyxb.20190313
The security of land use change is one of the important criteria for evaluating sustainable land use. The study takes Huajiang, Hongfenghu and Yachi rocky desertification control areas as examples, evaluates the security of land use change of rocky desertification control areas based on the "vertical-and-horizontal" method, and provides reference for evaluating the impact of land use change on rocky desertification and improving the land use pattern in the study areas. The results show that: (1) Land use change in the rocky desertification control areas is evident. The proportion of land use change in Huajiang, Hongfenghu and Yachi is 2.85%, 3.34% and 37.88%, respectively. Forest and construction land increased, while farmland and unused land decreased. (2) The comprehensive security and ecological, economic and social securities of land use change in different areas are different. The comprehensive security of Huajiang and Hongfenghu rose by 1.44% and 0.46%, while that of Yachi declined by 1.9%. In the Huajiang control area, the ecological and social securities were raised, and the economic security was declined. In the Hongfenghu control area, the ecological security rose, the economic security did not change remarkably, and the social security declined a little. In the Yachi control area, the ecological security declined significantly, the economic security rose a little, and the social security declined slightly. (3) The sensitivities of ecological, economic and social securities to land use change are different obviously, and ecological security is the most sensitive among these securities. The results reveal that the effect of land use change on ecological security is most obvious. In the follow-up rocky desertification control and land use planning, we should focus on the effect of land use change on ecological security.
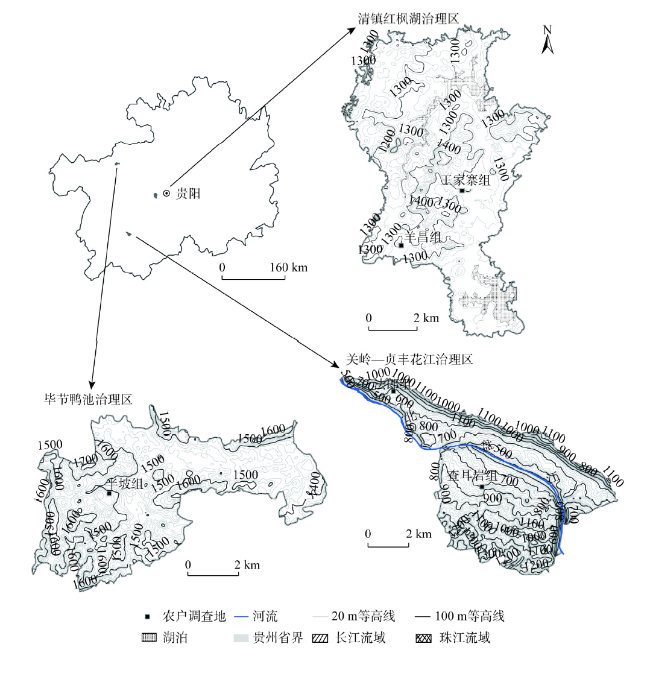
Fig. 1 Location of the study areas图1 研究区位置 |
Table 1 A survey of study areas表1 研究区概况 |
| 研究区 | 地貌类型 | 海拔/m | 面积/km2 | 降雨量/m | 喀斯特面积/km2 | 石漠化面积/km2 | 人口密度/(人/km2) | 治理起始时间/年 |
|---|---|---|---|---|---|---|---|---|
| 花江 | 高原峡谷 | 446~1359 | 51.62 | 1100 | 45.38 | 27.78 | 167 | 1996 |
| 红枫湖 | 高原盆地 | 1124~1438 | 60.44 | 1200 | 57.65 | 13.10 | 262 | 2001 |
| 鸭池 | 高原山地 | 1326~1721 | 41.53 | 863 | 26.36 | 9.47 | 513 | 2006 |
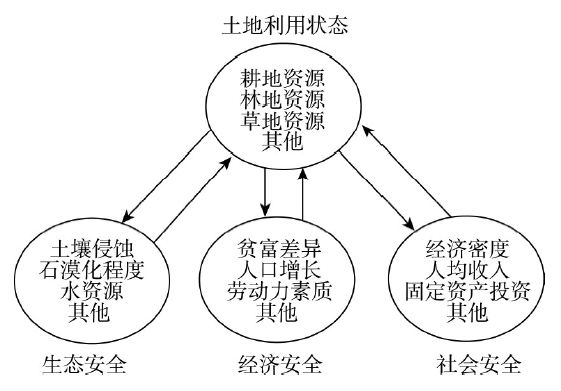
Fig. 2 Framework model on security assessment indicators of land use change图2 土地利用变化安全性评价指标体系框架模型 |
Table 2 The indicator system of security assessment of land use change表2 土地利用变化安全性评价指标体系 |
| 目标层 | 因子层 | 指标层(j) | 数据来源 | 指标含义 | 权重 |
|---|---|---|---|---|---|
| 土地利用变化的 安全性 | 状态(S) 土地利用 | 人均土地面积/亩 | 遥感调查 | 土地资源人均状态 | 0.00003 |
| 人均耕地面积/亩 | 遥感调查 | 耕地资源人均状态 | 0.02416 | ||
| 人均草地面积/亩 | 遥感调查 | 草地资源人均状态 | 0.00003 | ||
| 人均林地(园地)面积/亩 | 遥感调查 | 林地(园地)资源人均状态 | 0.00003 | ||
| 水田/旱地比率/% | 遥感调查 | 耕地结构状态 | 0.08912 | ||
| 响应(R)Ⅰ 生态安全 | 土壤侵蚀面积比例/% | 遥感调查 | 土壤保持水平响应 | 0.00003 | |
| 石漠化面积比例/% | 遥感调查 | 石漠化程度响应 | 0.08396 | ||
| 林灌草覆盖率/% | 遥感调查 | 植被覆盖度响应 | 0.00003 | ||
| 农业旱灾面积比例/% | 农户调查 | 农业旱灾响应 | 0.09066 | ||
| 人均水资源/m3 | 统计资料 | 水资源人均水平响应 | 0.00003 | ||
| 响应(R)Ⅱ 经济安全 | 经济密度/(元/hm2) | 统计资料 | 土地经济效益响应 | 0.07385 | |
| 人均地方财政收入/元 | 统计资料 | 地方财政人均水平响应 | 0.07071 | ||
| 农民人均纯收入/元 | 农户调查 | 农民收入水平响应 | 0.05570 | ||
| 人均固定资产投资/元 | 统计资料 | 国定资产投资人均水平响应 | 0.05467 | ||
| 恩格尔系数/% | 农户调查 | 农民生活水平响应 | 0.07533 | ||
| 响应(R)Ⅲ 社会安全 | 基尼系数(无量纲) | 农户调查 | 贫富差距水平响应 | 0.09051 | |
| 人口自然增长率/% | 农户调查 | 人口增长水平响应 | 0.09302 | ||
| 农村贫困发生率/% | 农户调查 | 当地贫困发生率响应 | 0.09199 | ||
| 富余劳动力转移率/% | 农户调查 | 富余劳动力转型就业机会响应 | 0.00715 | ||
| 劳动力平均受教育年限/年 | 农户调查 | 劳动力文化水平响应 | 0.09900 |
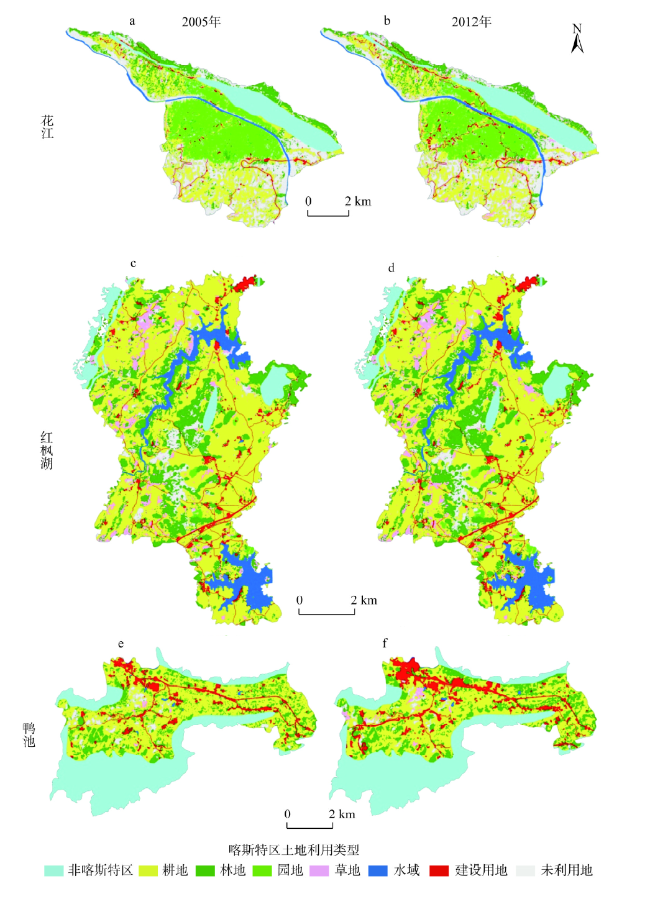
Table 3 Land use change of study areas in 2005 and 2012 (hm2)表3 2005-2012年研究区土地利用变化 |
| 地类 | 花江 | 红枫湖 | 鸭池 | ||||||||
|---|---|---|---|---|---|---|---|---|---|---|---|
| 2005年 | 2012年 | 2012年比2005年(+/-) | 2005年 | 2012年 | 2012年比2005年(+/-) | 2005年 | 2012年 | 2012年比2005年(+/-) | |||
| 耕地 | 717.46 | 706.72 | -10.74 | 3126.82 | 3101.73 | -25.09 | 1492.88 | 1370.89 | -121.99 | ||
| 园地 | 899.38 | 851.37 | -48.01 | 25.09 | 35.30 | 10.21 | 0.39 | 5.41 | 5.02 | ||
| 林地 | 1705.57 | 1696.02 | -9.55 | 1370.65 | 1444.39 | 73.74 | 785.75 | 806.86 | 21.11 | ||
| 草地 | 297.19 | 293.58 | -3.61 | 318.74 | 319.58 | 0.84 | 14.39 | 14.58 | 0.19 | ||
| 水域 | 74.39 | 117.20 | 42.81 | 461.38 | 458.39 | -2.99 | 18.18 | 18.59 | 0.41 | ||
| 建设用地 | 71.21 | 89.74 | 18.53 | 188.42 | 202.97 | 14.55 | 202.97 | 309.76 | 106.79 | ||
| 未利用地 | 773.23 | 783.80 | 10.57 | 274.38 | 203.12 | -71.26 | 121.01 | 109.48 | -11.53 | ||
| 合计 | 4538.43 | 4538.43 | / | 5765.48 | 5765.48 | / | 2635.57 | 2635.57 | / | ||
Fig. 3 Land use of the study areas in 2005 and 2012图3 2005年、2012年研究区土地利用图 |
Table 4 Comprehensive security assessment values of study areas in 2005 and 2012表4 2005年、2012年研究区安全性综合评价值 |
| 年份 | 花江 | 红枫湖 | 鸭池 |
|---|---|---|---|
| 2005 | 53.37 | 69.28 | 57.35 |
| 2012 | 54.14 | 69.60 | 56.26 |
Table 5 Ecological, economic and social security assessment values of study areas in 2005 and 2012表5 2005年、2012年研究区生态、经济、社会安全性评价值 |
| 研究区 | 生态安全 | 经济安全 | 社会安全 | |||||
|---|---|---|---|---|---|---|---|---|
| 2005年 | 2012年 | 2005年 | 2012年 | 2005年 | 2012年 | |||
| 花江 | 57.99 | 58.51 | 58.67 | 58.45 | 57.22 | 57.45 | ||
| 红枫湖 | 61.05 | 61.59 | 62.78 | 62.83 | 64.17 | 64.09 | ||
| 鸭池 | 60.97 | 59.90 | 58.54 | 58.72 | 58.61 | 58.46 | ||
Table 6 EK, FK, SK values of study areas表6 研究区EK、FK、SK值 |
| 研究区 | EK | FK | SK |
|---|---|---|---|
| 花江 | 2.27 | 0.96 | 1.05 |
| 红枫湖 | 3.85 | 0.11 | 0.21 |
| 鸭池 | 21.65 | 3.82 | 3.24 |
The authors have declared that no competing interests exist.
| [1] |
FAO. FESLM: An International Framework for Evaluation Sustainable Land Management. Rome: World Soil Resources Report 73, 1993: 12-80.
|
| [2] |
[
|
| [3] |
|
| [4] |
|
| [5] |
|
| [6] |
|
| [7] |
|
| [8] |
|
| [9] |
|
| [10] |
|
| [11] |
|
| [12] |
[
|
| [13] |
[
|
| [14] |
[
|
| [15] |
[
|
| [16] |
[
|
| [17] |
|
| [18] |
[
|
| [19] |
[
|
| [20] |
|
| [21] |
[
|
| [22] |
[
|
| [23] |
[
|
| [24] |
[
|
| [25] |
[
|
| [26] |
[
|
| [27] |
国家质量监督检验检疫总局. 中国国家标准管理委员会. 土地利用现状分类. 中华人民共和国国家标准(GB/T21010-2007). 北京: 中国标准出版社, 2007.
[Standardization Administration of the People's Republic of China. Current land use condition classification. China's National Standard (GB/T21010-2007). Beijing: Standards Press of China, 2007.]
|
| [28] |
[
|
| [29] |
[
|
/
| 〈 |
|
〉 |