
格网尺度下延安市生态服务价值时空演变格局与分异特征——基于退耕还林工程的实施背景
作者简介:侯孟阳(1988- ),男,河北邢台人,博士研究生,研究方向为资源经济与环境管理、农业经济与生态。E-mail: houmengyang@outlook.com
收稿日期: 2018-08-27
要求修回日期: 2019-01-25
网络出版日期: 2019-03-28
基金资助
林业公益性行业科研专项经费(201504424)
教育部人文社会科学重点基金项目(14JJD790031)
国家自然科学基金项目(71473195)
Spatial-temporal evolution pattern and differentiation of ecological service value in Yan'an city at the grid scale based on Sloping Land Conversion Program
Received date: 2018-08-27
Request revised date: 2019-01-25
Online published: 2019-03-28
Copyright
在退耕还林工程背景下,以退耕还林实施后生态效果较显著的延安市为研究对象,基于解译的三期影像数据,通过土地利用转移矩阵,在2 km×2 km的格网尺度下测算延安市不同土地利用类型的生态服务价值(ESV),并结合空间探索性数据分析,探讨ESV的不同土地利用类型转移的时间变化特征及空间转移的关联性和异质性。延安市的实证分析显示:(1)1990-2015年间,ESV的增减主要发生在耕地、林地和草地之间,林地和草地ESV合计转入21.29亿元,且转入量主要发生在退耕还林工程实施之后;(2)生态服务功能主要由林地和草地提供,ESV的时间变化经历了先下降后上升的过程,退耕还林工程的实施促进ESV的增长,2001-2015年间增长了5.34%;(3)空间探索性分析显示,ESV在格网尺度下呈现出显著的“南高北低”分布格局,并在空间上表现出正向的集聚性和依存性,ESV的高高集聚和低低集聚效果比较明显,并且高高集聚区与林地、草地的空间分布相吻合,低低集聚区与耕地、城乡建设用地的空间分布相吻合。整体而言,延安市土地利用类型转移和ESV的增减变化与推行退耕还林工程在时间上呼应、在空间上匹配,政府主导的退耕还林工程对生态环境恢复与保护起到显著的积极作用。因此,对于不同土地利用类型的生态服务功能,以耕地为主的北部地区应在基本农田保护制度基础上,注重农业生产与生态效益平衡,而林草资源丰富的南部地区则继续发挥生态屏障的调节作用。
侯孟阳 , 姚顺波 , 邓元杰 , 丁振民 , 鲁亚楠 , 郑雪 , 李雅男 . 格网尺度下延安市生态服务价值时空演变格局与分异特征——基于退耕还林工程的实施背景[J]. 自然资源学报, 2019 , 34(3) : 539 -552 . DOI: 10.31497/zrzyxb.20190308
Under the background of Sloping Land Conversion Program (SLCP), this study explores the temporal variation characteristics and the correlation and heterogeneity of spatial transfer of the ecological service value (ESV) for different land use types of Yan'an, a city with remarkable ecological improvement after the SCLP. To achieve this goal, the ESV of different land use types at a grid scale of 2 km × 2 km is calculated using land use transfer matrix achieved from the interpreted image data of three periods and exploratory spatial data analysis (ESDA). The results show that: (1) From 1990-2015, the increase (decrease) of ESV mainly occurred between arable lands, forests and grasslands, and the total ESV increased from forests and grassland was 2.129 billion yuan, the amount of transfer-in mainly occurred after the implementation of the SLCP; (2) The ecological service function was mainly provided by forestland and grassland, the ESV experienced a process of descending and then increasing from the temporal perspective, and the implementation of SLCP promoted the growth of ESV with an increase of 5.34% during 2001-2015; (3) The ESDA shows that, the ESV has a significant distribution of "high in the south, while low in the north" pattern at the grid scale which expresses positively spatial agglomeration and dependence, and it is obvious that the high-high aggregation area accorded with the spatial distribution of forestland and grassland whereas the low-low aggregation area accorded with that of farmland and construction land. Overall, the transfer of land use types and the changes of ESV in Yan'an city coincided with the implementation of SLCP temporally and spatially, which indicates that the SLCP, a government-dominated project, had a significantly positive effect on the restoration and protection of ecological environment. Therefore, with regard to the ecological service function of different land use types, the northern part of the study area with a large amount of cultivated land should pay attention to the balance between agricultural production and ecological benefits based on the basic farmland protection system, while the southern part with abundant forestland and grassland should continue to play a critical role in the regulation function of ecological barrier.
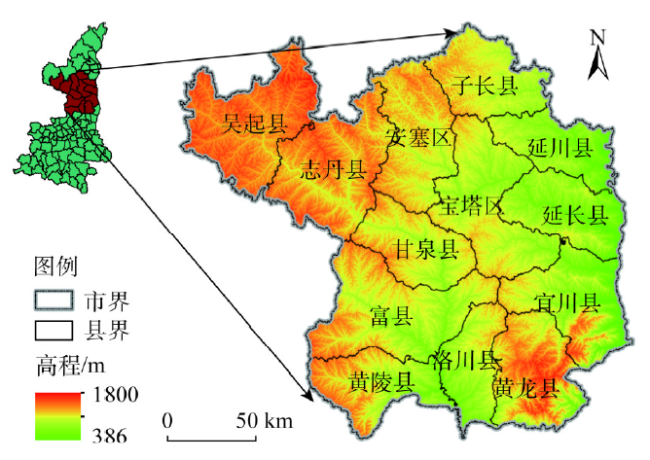
Fig. 1 Location of Yan'an in Shaanxi province图1 延安市在陕西省的位置 |
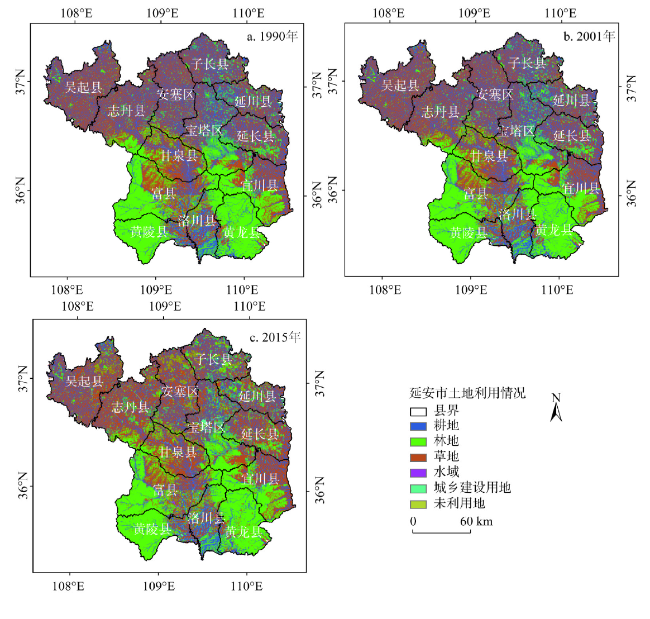
Fig. 2 The land use types of Yan'an in 1990, 2001 and 2015图2 1990年、2001年及2015年延安市土地利用类型 |
Table 1 The per unit area ESV of different land use types in Yan'an city (元/hm2)表1 延安市不同土地利用类型单位面积ESV |
| 一级分类 | 二级分类 | 农田 | 森林 | 草地 | 水域 | 城乡建设用地 | 未利用地 |
|---|---|---|---|---|---|---|---|
| 供给服务 | 食物生产 | 960.11 | 208.53 | 260.66 | 695.11 | 0 | 4.34 |
| 原料生产 | 212.88 | 480.78 | 386.65 | 199.84 | 0 | 13.03 | |
| 水资源供给 | -1133.89 | 249.08 | 212.88 | 7203.03 | 0 | 8.69 | |
| 调节服务 | 气体调节 | 773.30 | 1581.36 | 1351.11 | 669.04 | 0 | 56.48 |
| 气候调节 | 404.03 | 4729.61 | 3575.45 | 1989.74 | 0 | 43.44 | |
| 净化环境 | 117.30 | 1378.63 | 1181.68 | 4822.29 | 0 | 178.12 | |
| 水文调节 | 1298.98 | 2954.20 | 2619.68 | 88834.47 | 0 | 104.27 | |
| 支持服务 | 土壤保持 | 451.82 | 1923.12 | 1646.53 | 808.06 | 0 | 65.17 |
| 维持养分循环 | 134.68 | 147.71 | 125.99 | 60.82 | 0 | 4.34 | |
| 生物多样性 | 147.71 | 1752.24 | 1498.82 | 2215.65 | 0 | 60.82 | |
| 文化服务 | 美学景观 | 65.17 | 767.51 | 660.35 | 1642.19 | 0 | 26.07 |
| 合计 | 3432.08 | 16172.79 | 13519.80 | 109140.24 | 0 | 564.77 | |
Table 2 The ESV profit or loss matrix of Yan'an city in different periods (亿元)表2 不同时期延安市ESV损益矩阵 |
| 1990年 | 2001年 | ||||||
|---|---|---|---|---|---|---|---|
| 耕地 | 林地 | 草地 | 水域 | 城乡建设用地 | 未利用地 | 转出合计 | |
| 耕地 | 0 | 0.3840 | 0.0617 | 0.4030 | -0.0658 | 0 | 0.7829 |
| 林地 | -0.9502 | 0 | -0.1853 | 0.0099 | -0.8598 | 0 | -1.9855 |
| 草地 | -2.6698 | 0.4782 | 0 | 0.1051 | -0.0114 | 0 | -2.0979 |
| 水域 | -0.1927 | -0.0702 | -0.2673 | 0 | -0.0001 | 0 | -0.5302 |
| 城乡建设用地 | 0.0003 | 0.0003 | 0.0001 | 0 | 0 | 0 | 0.0007 |
| 未利用地 | 0.0007 | 0.0045 | 0.0179 | 0 | 0 | 0 | 0.0231 |
| 合计 | -3.8117 | 0.7968 | -0.3729 | 0.5180 | -0.9370 | 0 | -3.8069 |
| 2001年 | 2015年 | ||||||
| 耕地 | 林地 | 草地 | 水域 | 城乡建设用地 | 未利用地 | 转出合计 | |
| 耕地 | 0 | 10.6999 | 24.8491 | 1.0457 | -0.2939 | -0.0157 | 36.2852 |
| 林地 | -3.1926 | 0 | -1.1302 | 0.3198 | -1.0630 | -0.0647 | -5.1307 |
| 草地 | -8.7018 | 1.3369 | 0 | 1.0898 | -0.3797 | -0.1225 | -6.7772 |
| 水域 | -1.1458 | -0.2390 | -1.4460 | 0 | -0.1141 | -0.0218 | -2.9668 |
| 城乡建设用地 | 0.0312 | 0.0230 | 0.0477 | 0.0448 | 0 | 0 | 0.1468 |
| 未利用地 | 0.0007 | 0.0045 | 0.0179 | 0 | 0 | 0 | 0.0231 |
| 合计 | -13.0083 | 11.8253 | 22.3386 | 2.5002 | -1.8507 | -0.2247 | 21.5804 |
| 1990年 | 2015年 | ||||||
| 耕地 | 林地 | 草地 | 水域 | 城乡建设用地 | 未利用地 | 转出合计 | |
| 耕地 | 0 | 10.4862 | 24.0653 | 1.2651 | -0.3524 | -0.0156 | 35.4486 |
| 林地 | -3.7757 | 0 | -1.1695 | 0.3313 | -1.8046 | -0.0610 | -6.4794 |
| 草地 | -10.3300 | 1.7150 | 1.2015 | -0.4006 | -0.1258 | -7.9399 | |
| 水域 | -1.2135 | -0.3026 | -1.6700 | 0 | -0.1102 | -0.0218 | -3.3182 |
| 城乡建设用地 | 0.0269 | 0.0207 | 0.0401 | 0.0353 | 0 | 0 | 0.1228 |
| 未利用地 | 0.0007 | 0.0045 | 0.0179 | 0 | 0 | 0 | 0.0231 |
| 合计 | -15.2915 | 11.9238 | 21.2837 | 2.8332 | -2.6678 | -0.2242 | 17.8572 |
Table 3 Changes of ESV in different land use types in Yan'an city表3 延安市不同土地利用类型的ESV变化 |
| 土地利用类型 | ESV/亿元 | 变化率/% | |||||
|---|---|---|---|---|---|---|---|
| 1990年 | 2001年 | 2015年 | 1990-2001年 | 2001-2015年 | 1990-2015年 | ||
| 耕地 | 39.2966 | 40.2649 | 32.4692 | 2.46% | -19.84% | -17.37% | |
| 林地 | 179.9524 | 180.9463 | 191.5062 | 0.55% | 5.87% | 6.42% | |
| 草地 | 189.7549 | 184.7740 | 204.9246 | -2.62% | 10.62% | 7.99% | |
| 水域 | 15.7472 | 15.7074 | 15.3187 | -0.25% | -2.47% | -2.72% | |
| 城乡建设用地 | 0 | 0 | 0 | — | — | — | |
| 未利用地 | 0.0015 | 0.0015 | 0.0015 | 0 | 0 | 0 | |
| 合计 | 424.7526 | 421.6940 | 444.2202 | -0.72% | 5.34% | 4.62% | |
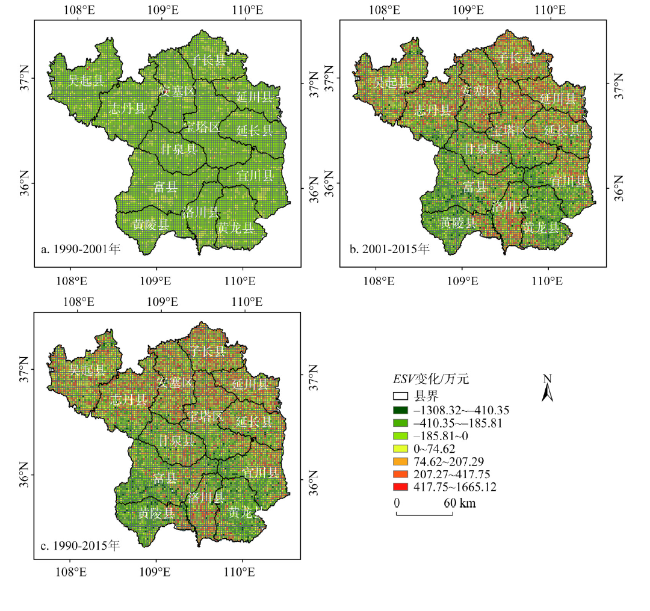
Fig. 3 Spatial distribution of ESV in different periods at the Grid Scale in Yan'an city图3 格网尺度下不同时期延安市ESV的空间分布 |
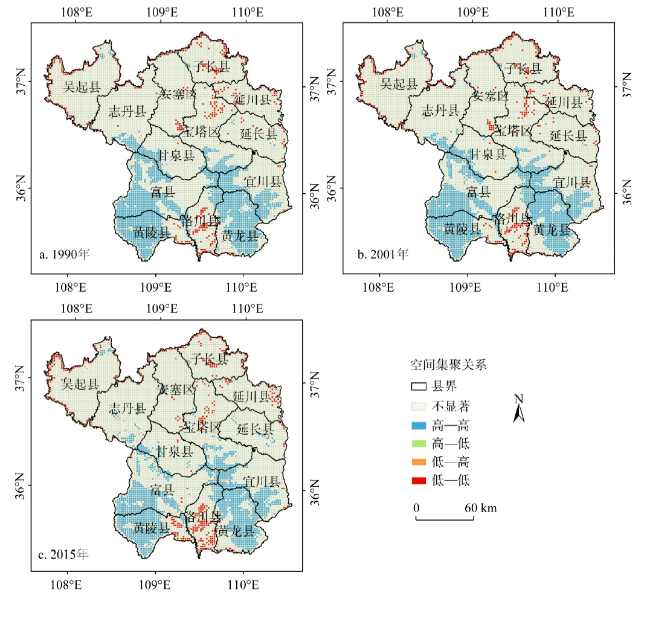
Fig. 4 The LISA aggregation of ESV in Yan'an city at the Grid Scale图4 格网尺度下延安市ESV的LISA集聚图 |
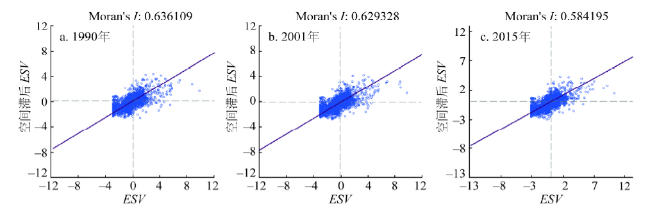
Fig. 5 The Moran scatter map of ESV in Yan'an city at the Grid Scale图5 格网尺度下延安市ESV的Moran散点图 |
The authors have declared that no competing interests exist.
| [1] |
[
|
| [2] |
[
|
| [3] |
|
| [4] |
|
| [5] |
[
|
| [6] |
[
|
| [7] |
|
| [8] |
[
|
| [9] |
|
| [10] |
[
|
| [11] |
[
|
| [12] |
[
|
| [13] |
[
|
| [14] |
[
|
| [15] |
[
|
| [16] |
[
|
| [17] |
[
|
| [18] |
[
|
| [19] |
[
|
| [20] |
[
|
| [21] |
[
|
| [22] |
国家发展和改革委员会价格司. 全国农产品成本收益汇编(1991-2016). 北京: 中国统计出版社, 1991-2016.
[The Price Department of the State Development and Reform Commission of China. National Agricultural Products Cost Return Assembly. Beijing: China Statistics Press, 1991-2016.]
|
| [23] |
[
|
| [24] |
[
|
| [25] |
[
|
| [26] |
|
/
| 〈 |
|
〉 |