
基于陆海统筹视角的国土空间开发建设适宜性评价——以辽宁省为例
作者简介:纪学朋(1991- ),男,山东章丘人,博士研究生,研究方向为资源环境与可持续发展。E-mail: zq_jixuepeng@163.com
收稿日期: 2018-09-01
要求修回日期: 2018-12-30
网络出版日期: 2019-03-28
基金资助
国家社科基金重大项目(17ZDA061)
Comprehensive suitability evaluation of spatial development and construction land in the perspective of land-ocean co-ordination:A case study of Liaoning province, China
Received date: 2018-09-01
Request revised date: 2018-12-30
Online published: 2019-03-28
Copyright
国土空间开发建设适宜性是优化国土空间开发格局、提升开发质量与效益的科学依据和基础保障,对实施区域协调发展战略具有重要意义。遵循城乡融合、陆海统筹原则,以东北地区唯一既沿海又沿边省份——辽宁省为例,从自然环境、经济社会、海洋功能三个维度构建适宜性评价指标体系,综合运用特尔斐法、木桶原理法则、线性加权求和法及多要素空间叠置分析等方法,对其国土空间开发建设适宜性进行评价与分析。结果表明:辽宁省国土空间开发建设适宜性空间分异明显,适宜建设区与基本适宜建设区呈明显的中心外围分布格局,沿沈大轴线、滨海轴线集聚分布;不适宜建设区以滨海线为轴带南北对称分布;基本不适宜建设区以沈大线为轴带东西对称分布。适宜、基本适宜、基本不适宜、不适宜建设区面积依次为15504.39 km2、22645.34 km2、66833.96 km2、68720.99 km2,分别占陆海国土的8.93%、13.04%、38.48%、39.56%。自然环境对区域国土空间开发建设具有基础性、决定性作用,不同等级、不同区域自然环境适宜性集聚与分散特性差异显著;经济社会对自然环境的适宜、基本适宜、基本不适宜建设区修正作用明显。海洋功能区的引入,极大拓展了辽宁省国土空间范围。但海洋功能适宜性空间分布极不均衡,由于海洋国土本身属性,其可供直接开发建设空间有限,而保护空间广阔,国土空间开发建设与生态环境保护之间的矛盾依然严峻。
纪学朋 , 黄贤金 , 陈逸 , 王丹阳 , 宋娅娅 . 基于陆海统筹视角的国土空间开发建设适宜性评价——以辽宁省为例[J]. 自然资源学报, 2019 , 34(3) : 451 -463 . DOI: 10.31497/zrzyxb.20190301
Comprehensive suitability evaluation of spatial development and construction land is the scientific basis and guarantee for optimizing spatial development pattern and improve its quality and efficiency. It is of great significance for the implementation of regional coordinated development strategy. In this paper, according to the principles of urban-rural integration and land-ocean co-ordination, we selected Liaoning province as a case, the only both coastal and border province in Northeast China. The suitability evaluation index system was established from 3 dimensions, including natural environment, economy and society, and marine function. To evaluate and analyze the suitability of spatial development and constructive land in this province, we integrated the application of Delphi method, cask theory, linear weighted summation model and multi-factors space overlay analysis. The results show that there exist obvious characteristics of spatial differentiation in the suitability of spatial development and construction land throughout Liaoning. The most and more suitable construction land represent an obvious central peripheral structure, and concentrate along both the Shenyang-Dalian axis and the Binhai axis; the most unsuitable construction land shows a north-south symmetric distribution by the Binhai axis, while the more unsuitable construction land shows an east-west symmetric distribution by the Shenyang-Dalian axis. The construction land areas of most suitability, more suitability, more unsuitability, and most unsuitability are 15504.39 km2, 22645.34 km2, 66833.96 km2, and 68720.99 km2, respectively, and the proportions of land-ocean area are 8.93%, 13.04%, 38.48%, and 39.56%, respectively. The suitability of natural environment plays a fundamental and decisive role in the development and construction of regional land; and the characteristics of agglomeration and dispersion are significantly different at different levels and regions. The suitability of economy and society obviously modifies that of natural environment. The introduction of marine functional zone has greatly expanded the regional land in Liaoning province, but the spatial distribution of marine functional suitability is extremely uneven. And due to the nature of marine functional zone, the space which can be directly developed and constructed is limited, while the space for protection is great. The contradiction between spatial development and ecological environment protection will be still severe for a long time.
Table 1 The index system of suitability evaluation of spatial development and construction land in Liaoning province表1 辽宁省国土空间开发建设适宜性评价指标体系 |
| 准则层 | 指标层 | 等级/分值 | |
|---|---|---|---|
| x1 | 地类名称 | 水田、水浇地、旱地、铁路用地、公路用地、农村道路、机场用地、港口码头用地、管道运输用地、城市、建制镇、村庄、采矿用地、风景名胜及特殊用地/1;其他草地、田坎、盐碱地、裸地/0.8;果园、茶园、其他园地、灌木林地、其他林地、坑塘水面、水工建筑用地、空闲地、设施农用地/0.6;有林地、天然牧草地、人工牧草地、沟渠/0.4;河流水面、湖泊水面、水库、沿海滩涂、内陆滩涂、沼泽地、沙地/0 | |
| 自然环境 适宜性 | x2 | 坡度 | 0~2°/1、2~8°/0.8、8~15°/0.6、15~25°/0.6、25°以上/0.4 |
| x3 | 滑坡泥石流 | 不易发区/1、低易发区/0.6、中易发区/0.6、高易发区/0.4 | |
| x4 | 地面沉降 | 轻微或稳定区/1、一般沉降区/0.8、较严重沉降区/0.6、严重沉降区/0.4、非沉降区/1 | |
| x5 | 活动断层 | 稳定区/1、轻微影响/0.8、较严重影响/0.8、严重影响/0.6 | |
| x6 | 生态用地 | 否/1、是/0 | |
| x7 | 规划用地管制区 | 非禁止建设区/1、禁止建设区/0 | |
| x8 | 矿山占用 | 非占用地/1;中转用地、矿山建筑/0.8;采场/0.6;塌陷、固体废弃/0.4 | |
| x9 | 岩溶塌陷 | 不易发区/1、中易发区/0.8、低易发区/0.8、高易发区/0.6 | |
| x10 | 地质遗迹 | 其他/1、缓冲区4 km×4 km/0.6、缓冲区6 km×6 km/0.6、缓冲区2 km×2 km/0.4 | |
| x11 | 优质耕地 | 非耕地/1、四等地/0.4、五等地/0.4、六等地/0.6、七等地/0.6、八等地/0.6、九等地/0.6、十等地以下/0.8 | |
| x12 | 基本农田 | 否/1、是/0 | |
| 经济社会 适宜性 | y1 | 人均可利用水资源/(m³/人) | ≥2000/1、1500~2000/0.8、1000~1500/0.6、500~1000/0.4、<500/0.2 |
| y2 | 国土开发强度/% | ≥40/1、15~40/0.8、11~15/0.6、7~11/0.4、<7/0.2 | |
| y3 | 交通优势度 | 便利/1、较便利/0.8、中等/0.6、较差/0.4、差/0.2 | |
| y4 | 人口集聚度 | ≥3.00/1、1.00~3.00/0.8、0.60~1.00/0.6、0.30~0.60/0.4、<0.30/0.2 | |
| y5 | 人均GDP/万元 | ≥13.63/1、7.93~13.63/0.8、5.07~7.93/0.6、3.28~5.07/0.4、1.02~3.28/0.2 | |
| y6 | 二三产业比例/% | ≥93/1、84~93/0.8、73~84/0.6、61~73/0.4、46~61/0.2 | |
| y7 | 人均可利用土地资源/(hm2/人) | ≥0.20/1、0.15~0.20/0.8、0.10~0.15/0.6、0.05~0.10/0.4、<0.05/0.2 | |
| 海洋功能 适宜性 | z | 海洋功能区 | 工业与城镇用海区/适宜;港口航运区、矿产能源区、旅游休闲娱乐区/基本适宜;特殊利用区/基本不适宜;农渔业区、海洋保护区、保留区/不适宜 |
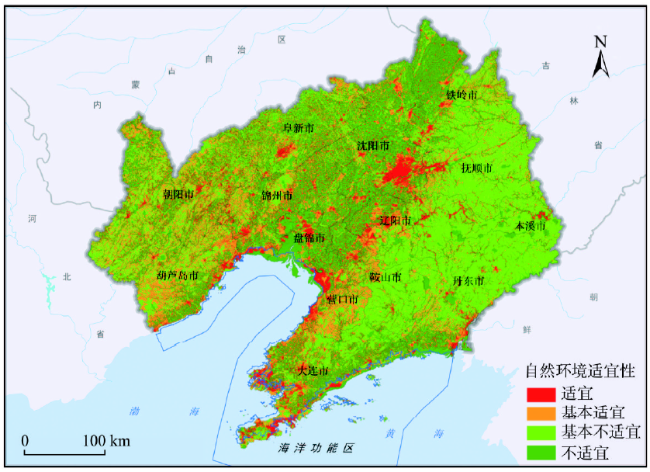
Fig. 1 The suitability of natural environment in Liaoning province图1 辽宁省自然环境适宜性 |
Table 2 The results of natural environment suitability in Liaoning province表2 辽宁省自然环境适宜性评价结果 |
| 名称 | 适宜 | 基本适宜 | 基本不适宜 | 不适宜 | |||||||
|---|---|---|---|---|---|---|---|---|---|---|---|
| 面积/km2 | 占比/% | 面积/km2 | 占比/% | 面积/km2 | 占比/% | 面积/km2 | 占比/% | ||||
| 辽宁省 | 15823.85 | 10.66 | 36727.47 | 24.74 | 49503.08 | 33.35 | 46369.74 | 31.24 | |||
| 沈阳市 | 2237.56 | 17.40 | 2200.45 | 17.12 | 1514.43 | 11.78 | 6904.27 | 53.70 | |||
| 大连市 | 2438.82 | 17.89 | 3254.49 | 23.88 | 3712.03 | 27.23 | 4225.90 | 31.00 | |||
| 鞍山市 | 808.91 | 8.72 | 1964.55 | 21.18 | 4075.51 | 43.95 | 2424.91 | 26.15 | |||
| 抚顺市 | 517.79 | 4.59 | 2331.53 | 20.69 | 7015.20 | 62.24 | 1406.50 | 12.48 | |||
| 本溪市 | 153.07 | 1.82 | 1256.79 | 14.94 | 5736.31 | 68.18 | 1267.76 | 15.07 | |||
| 丹东市 | 806.56 | 5.28 | 2323.59 | 15.20 | 8678.94 | 56.76 | 3480.52 | 22.76 | |||
| 锦州市 | 1408.33 | 14.02 | 2961.50 | 29.48 | 1477.42 | 14.70 | 4200.15 | 41.80 | |||
| 营口市 | 856.86 | 15.82 | 2367.08 | 43.71 | 925.37 | 17.09 | 1266.37 | 23.38 | |||
| 阜新市 | 1238.44 | 11.99 | 2397.33 | 23.21 | 2601.94 | 25.20 | 4089.28 | 39.60 | |||
| 辽阳市 | 553.33 | 11.68 | 1091.56 | 23.05 | 1502.70 | 31.73 | 1588.19 | 33.54 | |||
| 盘锦市 | 586.43 | 14.42 | 624.86 | 15.37 | 261.50 | 6.43 | 2592.61 | 63.77 | |||
| 铁岭市 | 1040.30 | 8.01 | 2570.95 | 19.80 | 3682.73 | 28.36 | 5690.53 | 43.83 | |||
| 朝阳市 | 2161.08 | 10.97 | 6892.18 | 34.99 | 5705.72 | 28.97 | 4938.80 | 25.07 | |||
| 葫芦岛市 | 1016.38 | 9.76 | 4490.61 | 43.12 | 2613.26 | 25.09 | 2293.96 | 22.03 | |||
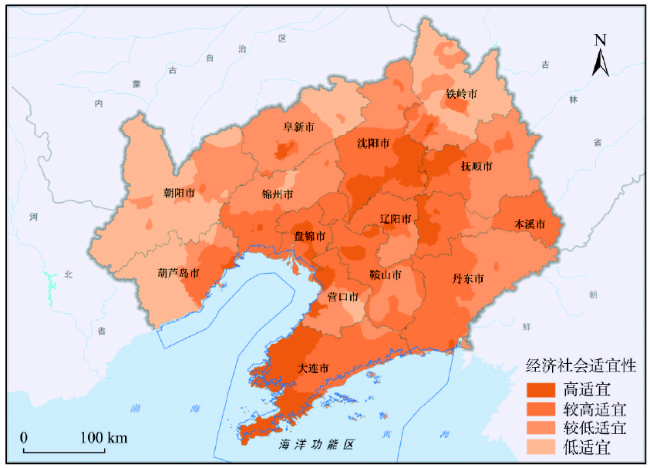
Fig. 2 The suitability of economy and society in Liaoning province图2 辽宁省经济社会适宜性 |
Fig. 3 The marine functional zoning of Liaoning province图3 辽宁省海洋功能区划 |
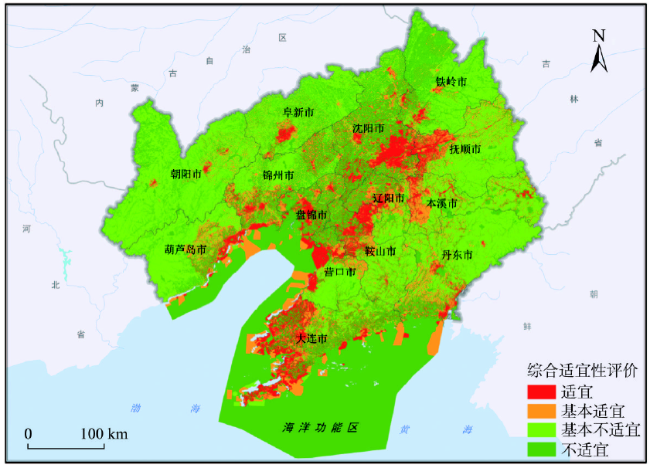
Fig. 4 The comprehensive suitability of spatial development and construction land in Liaoning province图4 辽宁省综合适宜性 |
Table 3 The results of comprehensive suitability evaluation in Liaoning province表3 辽宁省综合适宜性评价结果 |
| 名称 | 适宜 | 基本适宜 | 基本不适宜 | 不适宜 | |||||||
|---|---|---|---|---|---|---|---|---|---|---|---|
| 面积/km2 | 占比/% | 面积/km2 | 占比/% | 面积/km2 | 占比/% | 面积/km2 | 占比/% | ||||
| 辽宁省 | 15504.39 | 8.93 | 22645.34 | 13.04 | 66833.96 | 38.48 | 68720.99 | 39.56 | |||
| 沈阳市 | 2850.74 | 22.17 | 1579.48 | 12.28 | 1525.41 | 11.86 | 6904.27 | 53.69 | |||
| 大连市 | 3825.32 | 11.27 | 3900.41 | 11.49 | 2564.63 | 7.56 | 23651.69 | 69.68 | |||
| 鞍山市 | 1633.71 | 17.65 | 1482.87 | 16.02 | 3717.66 | 40.17 | 2421.13 | 26.16 | |||
| 抚顺市 | 1036.99 | 9.20 | 1882.86 | 16.71 | 6939.46 | 61.57 | 1411.72 | 12.53 | |||
| 本溪市 | 179.89 | 2.29 | 1713.58 | 21.80 | 4845.87 | 61.65 | 1121.05 | 14.26 | |||
| 丹东市 | 789.25 | 4.82 | 2732.75 | 16.69 | 8991.06 | 54.91 | 3860.89 | 23.58 | |||
| 锦州市 | 1038.43 | 9.46 | 2153.99 | 19.62 | 2991.69 | 27.24 | 4797.19 | 43.69 | |||
| 营口市 | 1041.50 | 16.71 | 1363.72 | 21.88 | 2379.14 | 38.17 | 1448.01 | 23.23 | |||
| 阜新市 | 356.98 | 3.46 | 943.57 | 9.14 | 4937.16 | 47.81 | 4089.28 | 39.60 | |||
| 辽阳市 | 646.66 | 13.65 | 1117.42 | 23.60 | 1383.51 | 29.21 | 1588.19 | 33.54 | |||
| 盘锦市 | 857.03 | 17.95 | 595.64 | 12.47 | 127.23 | 2.66 | 3195.01 | 66.91 | |||
| 铁岭市 | 471.21 | 3.61 | 701.54 | 5.38 | 6182.53 | 47.39 | 5690.53 | 43.62 | |||
| 朝阳市 | 122.27 | 0.62 | 794.58 | 4.03 | 13802.06 | 70.07 | 4978.87 | 25.28 | |||
| 葫芦岛市 | 654.40 | 5.30 | 1682.92 | 13.63 | 6446.55 | 52.21 | 3563.16 | 28.86 | |||
The authors have declared that no competing interests exist.
| [1] |
[
|
| [2] |
中华人民共和国国务院. 全国国土规划纲要(2016-2030年). 全国国土规划纲要(2016-2030年). 2017-01-03.
[State Council of the People's Republic of China. Outline of the national overall planning on land use (2006-2020). Outline of the national overall planning on land use (2006-2020). 2017-01-03.]
|
| [3] |
[
|
| [4] |
[
|
| [5] |
[
|
| [6] |
[
|
| [7] |
|
| [8] |
[
|
| [9] |
|
| [10] |
[
|
| [11] |
|
| [12] |
|
| [13] |
[
|
| [14] |
[
|
| [15] |
[
|
| [16] |
[
|
| [17] |
|
| [18] |
|
| [19] |
[
|
| [20] |
[
|
| [21] |
[
|
| [22] |
[
|
| [23] |
[
|
| [24] |
[
|
| [25] |
[
|
| [26] |
[
|
| [27] |
[
|
| [28] |
[
|
| [29] |
[
|
| [30] |
[
|
| [31] |
[
|
| [32] |
辽宁省统计局. 辽宁省统计年鉴. 北京: 中国统计出版社, 2015.
[Liaoning Provinical Bureau of Statistics. Liaoning Statistical Yearbook. Beijing: China Statistics Press, 2015.]
|
| [33] |
辽宁省人民政府. 辽宁省海洋功能区划(2011-2020年). 辽宁省海洋功能区划(2011-2020年).
[The People's Government of Liaoning Province. Marine Functional Zoning of Liaoning Province (2011-2020). Marine Functional Zoning of Liaoning Province (2011-2020).
|
/
| 〈 |
|
〉 |
