
中国粮食作物种植结构调整及其水土资源利用效应
作者简介:金涛(1969- ),女,江苏无锡人,博士,副教授,研究方向为区域农业发展。E-mail: tjin@yzu.edu.cn
收稿日期: 2018-07-18
要求修回日期: 2018-10-19
网络出版日期: 2019-01-20
基金资助
中国工程院咨询项目(2017-XY-28)
国家重点研发计划项目(2018YFD1100101)
江苏高校优势学科建设工程资助项目(PAPD)
The adjustment of China's grain cropping structure and its effect on the consumption of water and land resources
Received date: 2018-07-18
Request revised date: 2018-10-19
Online published: 2019-01-20
Copyright
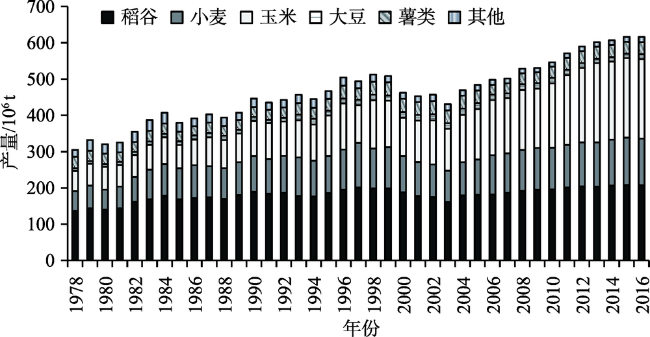
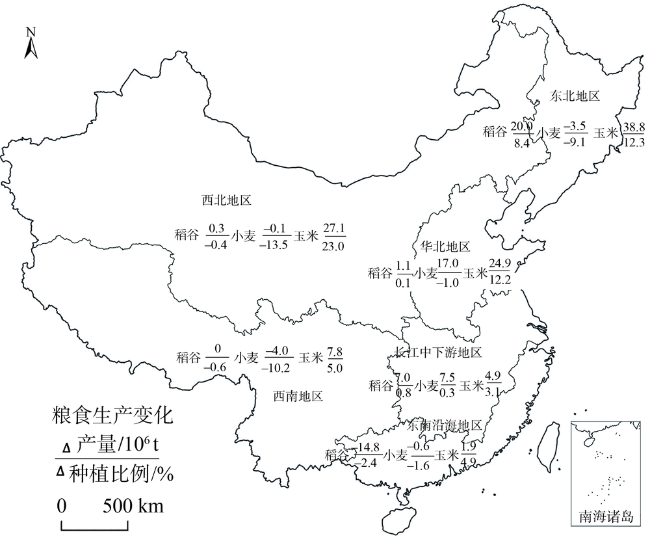
粮食种植结构调整会影响农业资源的消耗需求。20世纪90年代中后期以来,玉米在我国粮食生产中的地位明显提升。以粮食种植结构无调整为参照情景,一定产量下,1996-2015年,在国家层面,因粮食种植结构调整对水土资源消耗的节省量约占现期需求量的4%左右。在区域层面,从结构调整对种植面积的减省效应看,耕地资源相对丰富的北方地区明显高于南方地区;从对水资源消耗的减省效应看,北方贫水区也普遍高于南方地区,干旱度最高的西北地区最高。期间区域分品种粮食生产广泛受到作物种植比例变化的影响。研究结果表明,要充分利用好南方水热资源,恢复水稻生产,主要取决于稻米需求及其种植效益,而北方地区则要尽可能按降水规律调整农作制度,合理控制水稻、小麦的种植面积。
金涛 . 中国粮食作物种植结构调整及其水土资源利用效应[J]. 自然资源学报, 2019 , 34(1) : 14 -25 . DOI: 10.31497/zrzyxb.20190102
Estimation of the effect of grain production adjustment on the consumption of water and land resources will help to formulate the strategy for sustainable agricultural development. Since the mid and late 1990s, the proportion of corn in China's grain production has been obviously improved. Taking grain cropping structure without adjustment as the base scenario, and under certain grain output, the actual grain production adjustment in China during 1996-2015 has brought about the savings of water and land resources, accounting for about 4.2% and 3.7% of current demand in grain production respectively. The adjustment of grain production comes from grain demand structure change, which helps to alleviate the consumption pressure of water/land resources in grain production to some extent, though China's dietary transformation requires more agricultural resources. At the regional level, from the effect of structural adjustment on the demand for planting area, the savings in northern regions with relatively abundant arable land resources are significantly higher than those in the south. The area saving effect is higher in the northeast and northwest regions, and the least in southeastern coastal areas. From the effect of structural adjustment on the demand for water resources, the savings in northern regions are generally higher than those in the south, the highest in the northwest region with the highest drought degree, and the water saving effect in the middle and lower reaches of the Yangtze River is minimal. During the period, the output of regional grain crops has been widely affected by the change of cropping proportion, which is the indicator of the planting benefit and implies the change of consumption demand. Feed grain demand has increased more than rice and wheat rations, making the northern region suitable for corn planting become China's main grain production area. In the southern rice region, the demand for rice is relatively limited, and the regional production advantages of wheat, corn and soybeans are also lacking, which causes the relative stagnation of grain production in the south. To this end, in southern China, the recovery of grain production and full utilization of the potential of water/heat resources mainly depend on the consumption demand for rice and farmers' planting benefit. For the northern region, in order to reduce the amount of groundwater irrigation, it is necessary to rationally control the cropping area of rice and wheat and to adjust farming system according to the law of precipitation as far as possible.
Table 1 Data revision of provincial cultivated land area and regional virtual water contents in the main grain products表1 耕地面积数据订正与主要粮食作物产品单位质量虚拟水含量 |
| 地区 | 省份 | 1996年耕地面积/103 hm2 | 2008年耕地面积/103 hm2 | 单位质量虚拟水含量/m3/kg | ||||||||
|---|---|---|---|---|---|---|---|---|---|---|---|---|
| 一调结果 | 二调接轨订正 | 一调口径 | 二调接轨订正 | 水稻 | 小麦 | 玉米 | 大豆 | 薯类 | ||||
| 华北 地区 | 北京 | 343.9 | 336.6 | 231.7 | 224.4 | 1.33 | 1.15 | 0.83 | 2.88 | 1.01 | ||
| 天津 | 485.6 | 488.6 | 441.1 | 444.1 | ||||||||
| 河北 | 6883.3 | 7122.4 | 6317.3 | 6556.4 | ||||||||
| 山西 | 4588.6 | 4598.2 | 4055.8 | 4065.4 | ||||||||
| 山东 | 7689.3 | 7832.3 | 7515.3 | 7658.3 | ||||||||
| 河南 | 8110.3 | 8361.6 | 7926.4 | 8177.7 | ||||||||
| 东北 地区 | 辽宁 | 4174.8 | 5119.1 | 4085.3 | 5029.6 | 1.22 | 1.20 | 0.78 | 2.55 | 1.62 | ||
| 吉林 | 5578.4 | 7065.1 | 5534.6 | 7021.3 | ||||||||
| 黑龙江 | 11773.0 | 15802.2 | 11830.1 | 15859.3 | ||||||||
| 西北 地区 | 内蒙古 | 8201.0 | 10242.8 | 7147.2 | 9189.0 | 1.43 | 1.38 | 0.88 | 3.19 | 1.54 | ||
| 陕西 | 5140.5 | 5083.4 | 4050.3 | 3993.2 | ||||||||
| 甘肃 | 5024.7 | 5764.4 | 4658.8 | 5398.5 | ||||||||
| 青海 | 688.0 | 733.3 | 542.7 | 588.0 | ||||||||
| 宁夏 | 1268.8 | 1448.3 | 1107.1 | 1286.6 | ||||||||
| 新疆 | 3985.7 | 4987.1 | 4124.6 | 5126.0 | ||||||||
| 长江 中下游 地区 | 上海 | 315.1 | 259.7 | 244.0 | 188.6 | 1.34 | 1.09 | 0.96 | 2.55 | 1.09 | ||
| 江苏 | 5061.7 | 4896.8 | 4763.8 | 4598.9 | ||||||||
| 安徽 | 5971.7 | 6138.2 | 5730.2 | 5896.7 | ||||||||
| 江西 | 2993.4 | 3252.7 | 2827.1 | 3086.4 | ||||||||
| 湖北 | 4949.5 | 5597.8 | 4664.1 | 5312.4 | ||||||||
| 湖南 | 3953.0 | 4301.0 | 3789.4 | 4137.4 | ||||||||
| 东南 沿海 地区 | 浙江 | 2125.3 | 2188.4 | 1920.9 | 1984.0 | 1.55 | 1.26 | 1.24 | 2.38 | 1.14 | ||
| 福建 | 1434.7 | 1443.9 | 1330.1 | 1339.3 | ||||||||
| 广东 | 3272.2 | 3007.1 | 2830.7 | 2565.6 | ||||||||
| 广西 | 4407.9 | 4616.1 | 4217.5 | 4425.7 | ||||||||
| 海南 | 762.1 | 763.8 | 727.5 | 729.2 | ||||||||
| 西南 地区 | 重庆 | 2235.9 | 2443.2 | 1.34 | 1.55 | 1.11 | 2.59 | 1.42 | ||||
| 四川 | 9169.1 | 10152.1 | 5947.4 | 6723.1 | ||||||||
| 贵州 | 4903.5 | 4981.6 | 4485.3 | 4563.4 | ||||||||
| 云南 | 6421.6 | 6588.7 | 6072.1 | 6239.2 | ||||||||
| 西藏 | 362.6 | 443.6 | 361.6 | 442.6 | ||||||||
Fig. 1 Total amount and structure of grain production in China during 1978-2016图1 1978-2016年我国粮食产量及其构成变化 |
Fig. 2 Production change of the three major cereals for 6 regions during 1996-2015图2 1996-2015年三大谷物区域生产变化 |
Table 2 Effect of grain cropping structure adjustment during 1996-2015 on grain sown area表2 1996-2015年粮食种植结构调整对粮食种植面积的影响 |
| 地区 | 现实增减/103 hm2 | 有调整情景/103 hm2 | 无调整情景/103 hm2 | 因调整节约的面积/103 hm2 | 节约率/% |
|---|---|---|---|---|---|
| 东北地区 | 5641.1 | 20043.5 | 22701.2 | 2657.7 | 13.3 |
| 华北地区 | -292.7 | 27812.9 | 29742.7 | 1929.7 | 6.9 |
| 西北地区 | 923.3 | 15032.5 | 17648.1 | 2615.6 | 17.4 |
| 长江中下游地区 | -498.5 | 25259.8 | 25527.2 | 267.4 | 1.1 |
| 东南沿海地区 | -4281.1 | 8390.1 | 8399.8 | 9.7 | 0.1 |
| 西南地区 | -299.0 | 16494.4 | 16717.2 | 222.8 | 1.4 |
| 全国平均 | 1 193.2 | 113 033.4 | 117 209.7 | 4 176.3 | 3.7 |
Table 3 Effect of grain cropping structure adjustment during 1996-2015 on the consumption of water resources表3 1996-2015年粮食种植结构调整对粮食生产水资源消耗量的影响 |
| 地区 | 现实增减/亿m3 | 有调整情景/亿m3 | 无调整情景/亿m3 | 因调整的节水量/亿m3 | 节水率/% |
|---|---|---|---|---|---|
| 东北地区 | 486.4 | 1184.2 | 1245.2 | 61.1 | 5.2 |
| 华北地区 | 299.7 | 1603.1 | 1679.0 | 75.9 | 4.7 |
| 西北地区 | 269.1 | 809.0 | 909.2 | 100.2 | 12.4 |
| 长江中下游地区 | 174.7 | 1887.7 | 1888.1 | 0.4 | 0 |
| 东南沿海地区 | -229.5 | 669.5 | 673.5 | 4.0 | 0.6 |
| 西南地区 | 114.3 | 1040.9 | 1050.6 | 9.7 | 0.9 |
| 全国平均 | 1178.2 | 7211.5 | 7516.2 | 304.7 | 4.2 |
Table 4 Factors decomposition of production changes during 1996-2015 by region and by crop (万t)表4 1996-2015年分区域粮食作物产量变化的构成因素 |
| 品种 | 产量变化 | 作物单产 | 种植比例 | 复种指数 | 耕地面积 | |
|---|---|---|---|---|---|---|
| 东北地区 | 稻谷 | 2002.6 | 272.4 | 1098.5* | 646.1 | -14.3 |
| 小麦 | -351.8 | 26.8 | -421.2* | 43.6 | -1.0 | |
| 玉米 | 3882.9 | 856.4 | 1486.7* | 1574.6* | -34.9 | |
| 其他 | -150.0 | -8.6 | -440.2* | 305.5* | -6.8 | |
| 华北地区 | 稻谷 | 112.0 | 96.8* | -11.7 | 68.6* | -41.7 |
| 小麦 | 1701.9 | 1914.8* | -492.6 | 713.2 | -433.5 | |
| 玉米 | 2489.4 | 741.4 | 1527.9* | 561.2 | -341.1 | |
| 其他 | -815.0 | 9.6 | -871.8* | 120.3 | -73.1 | |
| 西北地区 | 稻谷 | 29.4 | 54.9 | -92.0* | 92.0* | -25.5 |
| 小麦 | -6.0 | 578.3 | -995.5* | 569.3 | -158.1 | |
| 玉米 | 2713.3 | 653.2 | 1399.2* | 914.9 | -254.0 | |
| 其他 | 99.6 | 312.1* | -446.7* | 324.2* | -90.0 | |
| 长江中下游地区 | 稻谷 | 695.5 | 746.1* | -264.5 | 754.2* | -540.3* |
| 小麦 | 750.1 | 769.1* | -77.9 | 207.5 | -148.7 | |
| 玉米 | 487.6 | 124.4 | 341.5* | 76.7 | -54.9 | |
| 其他 | -442.4 | -126.5 | -337.7* | 76.7 | -55.0 | |
| 东南沿海地区 | 稻谷 | -1478.3 | 379.0 | -1191.4* | -327.7 | -338.2 |
| 小麦 | -58.4 | 16.3 | -65.7* | -4.4 | -4.6 | |
| 玉米 | 185.8 | 127.6* | 106.8* | -23.9 | -24.7 | |
| 其他 | -141.4 | 155.7* | -192.7* | -51.4 | -53.0 | |
| 西南地区 | 稻谷 | -3.2 | 126.0 | -594.5* | 732.8* | -267.5 |
| 小麦 | -396.6 | 119.7 | -634.7* | 186.5 | -68.1 | |
| 玉米 | 776.8 | 434.2* | 92.8 | 393.3* | -143.6 | |
| 其他 | 562.7 | 312.1* | 15.2 | 370.7* | -135.3 | |
注:*为基于效应值的首位贡献因子,以及效应值超过首位因子2/3的第二/三因子。 |
The authors have declared that no competing interests exist.
| [1] |
[
|
| [2] |
|
| [3] |
[
|
| [4] |
|
| [5] |
[
|
| [6] |
[
|
| [7] |
[
|
| [8] |
|
| [9] |
|
| [10] |
[
|
| [11] |
[
|
| [12] |
|
| [13] |
[
|
| [14] |
[
|
| [15] |
[
|
| [16] |
[
|
| [17] |
[
|
| [18] |
[
|
| [19] |
[
|
| [20] |
[
|
| [21] |
[
|
| [22] |
[
|
| [23] |
[
|
/
| 〈 |
|
〉 |