
农业文化遗产地“三产”融合度评价——以云南红河哈尼稻作梯田系统为例
作者简介:张永勋(1983- ),男,河南光山人,助理研究员,主要从事农业文化遗产保护与发展、可持续农业与乡村发展、生态经济方面的研究。E-mail: zhangyongxun@caas.cn
收稿日期: 2018-07-22
要求修回日期: 2018-11-07
网络出版日期: 2019-01-20
基金资助
云南省红河州委托项目
农业部国际交流合作项目
中国农业科学院科技创新工程(CAAS-ASTIP-IAED-2018-06)
The evaluation of industrial integration level of important agricultural heritage sites:A case study of Yunnan Honghe Hani rice terraces
Received date: 2018-07-22
Request revised date: 2018-11-07
Online published: 2019-01-20
Copyright
工业化和城市化过程中,城乡经济差距日益拉大,农村衰落已成为城市化过程中各国面临的共同问题。2015年中央政府提出了“农村一二三产业融合发展”推动农村经济发展的政策,引起了众多学科研究者从不同角度开展研究,但相关研究多以理论探讨为主。农业文化遗产地作为一个以遗产保护为前提的特殊农村地区,如何推动一二三产业(下称“三产”)融合发展,如何量化“三产”融合度,研究尚待深入。基于对农业文化遗产特点、资源特征以及农业文化遗产保护要求等方面的分析,阐释了农业文化遗产地“三产”融合发展的概念和内涵,并构建了由产业融合度与劳动力融合度组成的农业文化遗产地“三产”融合度评价方法体系及具体核算方法。以云南红河哈尼稻作梯田系统十大片区所在的8个乡镇为对象进行评价,结果表明,产业融合度分项指数间越均衡则产业融合度越高;各乡镇分项指数和产业融合度的数值皆很小,有巨大的“三产”融合发展空间;新街镇一二三产业的劳动力融合度领先,其中第三产业贡献率最大;农业文化遗产地“三产”的产业融合与劳动力融合有较高的正相关性(r=0.67),显著水平在10%以下(P=0.069<0.1)。推动“三产”融合发展可以有效促进农民在本地就业,对于保护农业文化遗产有着重要意义。
张永勋 , 闵庆文 , 徐明 , 李先德 . 农业文化遗产地“三产”融合度评价——以云南红河哈尼稻作梯田系统为例[J]. 自然资源学报, 2019 , 34(1) : 116 -127 . DOI: 10.31497/zrzyxb.20190110
With industrialization and urbanization, the economic gap between rural areas and urban areas is widening. The rural decline has become a problem facing most of the countries. Under this background, the policy of industrial integration development was proposed by the central government of China, aiming at propelling rural economic development. The policy attracted researchers from different disciplines to conduct research from different perspectives. However, most studies have just explored the theories of industrial integration in rural areas, and the quantified case studies are still hardly found. Especially for the Important Agricultural Heritage System (IAHS) Sites as a special rural area, how to promote the development of industrial integration and how to quantify the integration level among primary, secondary and tertiary industries is poorly documented. Thus, in this study, considering the characteristics, resource features and protection demands of IAHS sites, we proposed the concept and connotation of industrial integration development in IAHS sites, and set up an evaluation methodology consisting of industrial integration degree (IID) and labor integration degree (LID) and calculation methods. Taking the eight towns in the Honghe Hani rice terraced systems site, Yunnan as an example, we evaluated the IID and LID of each town. The results are shown as follows. The more balance among the sub-indices of IID and LID of each town, the higher the industrial integration level; all the sub-indices of IID and LID of each town are very small, and a huge development space exists for every town. In the eight towns, Xinjie Township has a highest IID and LID due to the biggest contribution from the tertiary industry; a highly positive correlation is between the IID and the LID of each township (r=0.67), which is below 10% in significance level (P=0.069<0.1). In conclusion, in IAHS sites, integrated industrial development can enhance the employment percentage of local people.
Fig. 1 The evaluated cells and their distribution of the studied towns图1 研究区评价单元及其空间分布 |
Table 1 The economic situations of towns and the secondary and tertiary industrial situations related with agriculture表1 各乡镇经济概况及涉农第二三产业的状况 |
| 地名 | 总产值 /万元 | 第一产业 | 第二产业 | 第三产业 | 农产品 加工业/万元 | 住宿及 餐饮业/万元 | |||||
|---|---|---|---|---|---|---|---|---|---|---|---|
| 产值 | 占比/% | 产值/万元 | 占比/% | 产值/万元 | 占比/% | ||||||
| 甲寅镇 | 20065 | 14219 | 70.9 | 3511 | 17.5 | 2335 | 11.6 | 224 | 213 | ||
| 宝华镇 | 18661 | 14345 | 76.9 | 854 | 4.6 | 3462 | 18.6 | 153 | 431 | ||
| 新街镇 | 108846 | 31640 | 29.1 | 25100 | 23.1 | 52106 | 47.9 | 3608 | 14900 | ||
| 牛角寨乡 | 25150 | 18876 | 75.1 | 5114 | 20.3 | 1160 | 4.6 | 2345 | 68 | ||
| 攀枝花乡 | 10516 | 8545 | 81.3 | 840 | 8.0 | 1131 | 10.8 | 246 | 160 | ||
| 三猛乡 | 17955 | 15467 | 86.1 | 1743 | 9.7 | 745 | 4.1 | 503 | 102 | ||
| 阿得博乡 | 7326 | 6226 | 85.0 | 400 | 5.5 | 700 | 9.6 | 128 | 230 | ||
| 马鞍底乡 | 9180 | 7879 | 85.8 | 292 | 3.2 | 1009 | 11.0 | 130 | 324 | ||
Table 2 The number of employees in the secondary and tertiary industries related with the agriculture表2 各乡镇就业及二三产业中涉农产业从业人数 |
| 地名 | 乡村从 业人数/人 | 第一产业 | 第二产业 | 第三产业 | 二产涉农产业人数/人 | 三产涉农产业人数/人 | |||||
|---|---|---|---|---|---|---|---|---|---|---|---|
| 人数/人 | 占比/% | 人数/人 | 占比/% | 人数/人 | 占比/% | ||||||
| 甲寅镇 | 15346 | 8654 | 56.4 | 910 | 5.9 | 3087 | 20.1 | 616 | 18 | ||
| 宝华镇 | 15430 | 12265 | 79.5 | 274 | 1.8 | 1582 | 10.3 | 23 | 52 | ||
| 新街镇 | 43233 | 29933 | 69.2 | 3760 | 8.7 | 6765 | 15.6 | 696 | 2000 | ||
| 牛角寨乡 | 21986 | 14153 | 64.4 | 513 | 2.3 | 1454 | 6.6 | 671 | 86 | ||
| 攀枝花乡 | 13128 | 12578 | 95.8 | 107 | 0.8 | 499 | 3.8 | 41 | 22 | ||
| 三猛乡 | 14965 | 14190 | 94.8 | 835 | 5.6 | 986 | 6.6 | 30 | 31 | ||
| 阿得博乡 | 9029 | 7078 | 78.4 | 558 | 6.2 | 1163 | 12.9 | 52 | 44 | ||
| 马鞍底乡 | 12041 | 8813 | 73.2 | 199 | 1.7 | 635 | 5.3 | 20 | 86 | ||
Table 3 The yields of agricultural product in each town in 2014 (t)表3 2014年各乡镇主要农产品产量 |
| 地名 | 总质量 | 粮食 | 其中, 水稻 | 蔬菜 | 甘蔗 | 棕片 | 肉类 | 木薯 | 草果 | 核桃 | 茶叶 | 花生 | 芭蕉芋 | 青饲料 | 香蕉 |
|---|---|---|---|---|---|---|---|---|---|---|---|---|---|---|---|
| 甲寅 | 66027 | 10290 | 6036 | 5849 | 17570 | 27025 | 5293 | — | — | — | — | — | — | — | — |
| 宝华 | 157359 | 11100 | 7274 | 16986 | 16642 | 4587 | 2844 | 103200 | 1000 | 1000 | — | — | — | — | — |
| 新街 | 70890 | 28215 | 12521 | 1257 | 14559 | — | 8406 | 17164 | 1289 | — | — | — | — | — | — |
| 牛角寨 | 33052 | 16855 | 10577 | 4229 | 6325 | — | 5343 | — | — | — | — | — | — | — | 300 |
| 攀枝花 | 20642 | 9202 | 5654 | 376 | 1385 | — | 3247 | 5629 | — | — | — | 804 | — | — | |
| 三猛 | 19139 | 12333 | 4720 | 2130 | 276 | — | 2926 | 106 | 248 | — | 766 | 228 | 125 | — | — |
| 阿得博 | 25951 | 6790 | 4565 | 1116 | 16180 | — | 1865 | — | — | — | — | — | — | — | — |
| 马鞍底 | 25604 | 10519 | 6564 | 1147 | — | — | 2604 | 2600 | — | 720 | — | — | 1112 | 601 |
Table 4 Evaluated values of the rate of different agricultural products inflowing the secondary and tertiary industries in the towns in 2014 (%)表4 2014年各乡镇各类农产品的二三产业流入率估值 |
| 地名 | 大米/% | 米线/% | 棕丝/% | 肉类/% | 蔬菜/% |
|---|---|---|---|---|---|
| 甲寅镇 | 100 | 35 | 40 | 100 | 5 |
| 宝华镇 | 100 | 35 | — | 100 | 10 |
| 新街镇 | 100 | 60 | — | 100 | 25 |
| 牛角寨乡 | 100 | 35 | — | 100 | 1 |
| 攀枝花乡 | 100 | 35 | — | 100 | 10 |
| 三猛乡 | 100 | 35 | — | 100 | 1 |
| 阿得博乡 | 100 | 35 | — | 100 | 1 |
| 马鞍底乡 | 100 | 35 | — | 100 | 15 |
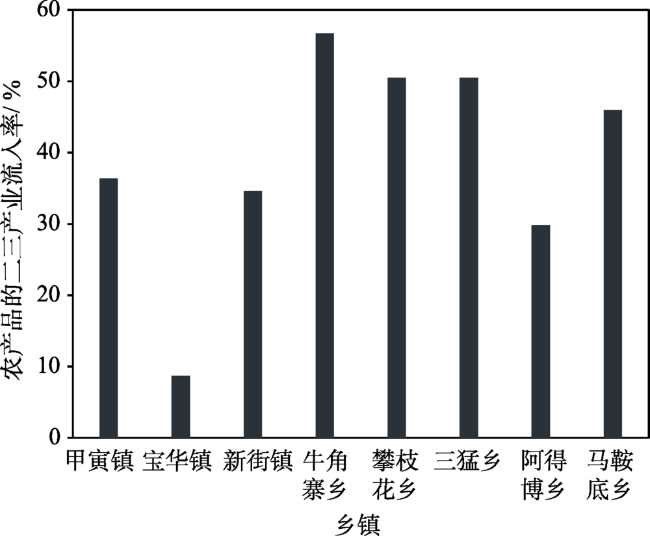
Fig. 2 The total rate of agricultural products inflowing the secondary and tertiary industries in the towns in 2014图2 各乡镇农产品二三产业流入率 |
Table 5 The total industrial integration degree and the total labor integration degree among the three industries and the sub-indices of the two indices表5 “三产”产业融合度和劳动力融合度及分项指数 |
| 乡镇 | 产业融合度 | 劳动力融合度 | ||||||
|---|---|---|---|---|---|---|---|---|
| 甲寅镇 | 0.258 | 0.011 | 0.011 | 0.031 | 0.040 | 0.001 | 0.007 | |
| 宝华镇 | 0.067 | 0.008 | 0.023 | 0.023 | 0.001 | 0.003 | 0.002 | |
| 新街镇 | 0.101 | 0.033 | 0.137 | 0.077 | 0.016 | 0.046 | 0.027 | |
| 牛角寨乡 | 0.426 | 0.093 | 0.003 | 0.048 | 0.031 | 0.004 | 0.011 | |
| 攀枝花乡 | 0.410 | 0.023 | 0.015 | 0.053 | 0.003 | 0.002 | 0.002 | |
| 三猛乡 | 0.435 | 0.028 | 0.006 | 0.041 | 0.002 | 0.002 | 0.002 | |
| 阿得博乡 | 0.253 | 0.017 | 0.031 | 0.052 | 0.006 | 0.005 | 0.005 | |
| 马鞍底乡 | 0.395 | 0.014 | 0.035 | 0.058 | 0.002 | 0.007 | 0.003 | |
The authors have declared that no competing interests exist.
| [1] |
|
| [2] |
|
| [3] |
|
| [4] |
|
| [5] |
|
| [6] |
|
| [7] |
[
|
| [8] |
|
| [9] |
[
|
| [10] |
[
|
| [11] |
[
|
| [12] |
[
|
| [13] |
[
|
| [14] |
[
|
| [15] |
[
|
| [16] |
[
|
| [17] |
[
|
| [18] |
[
|
/
| 〈 |
|
〉 |
