
基于站点观测和模式模拟的北京市土壤湿度
作者简介:秦道清(1994- ),女,四川人,硕士研究生,研究方向为水资源系统分析。E-mail: qindaoqinglinda@163.com
收稿日期: 2018-06-19
要求修回日期: 2018-10-10
网络出版日期: 2019-01-20
基金资助
国家重点研发计划(2016YFC0401407)
国家自然科学基金项目(51879010,51479003)
Soil moisture in Beijing based on site observation and model simulation
Received date: 2018-06-19
Request revised date: 2018-10-10
Online published: 2019-01-20
Copyright
为了获取全面的地面表层的时空变化信息,研究行政区域尺度内的水循环和能量循环,必需结合模型模拟和站点观测。基于国家气象局开发的时空连续的CLDAS土壤湿度产品,结合已获取的北京市区域内82个监测站点的逐日土壤湿度监测数据,评估CLDAS土壤湿度产品在行政区域尺度内的准确性与一致性,进一步获取北京市行政区域内的精确、全面、连续的土壤湿度时空变化信息,并在此基础上分析北京市土壤墒情时空变异特征。对比分析CLDAS产品和站点观测两种土壤湿度数据显示,北京市2013年10月1日至12月31日范围内CLDAS产品具有以下特点:CLDAS产品基本与观测数据具有一致变化的趋势,除顺义外CLDAS产品均高于观测数据。当日20∶00的土壤湿度均高于8∶00的土壤湿度,在平均气温降为0 ℃后,土壤湿度波动剧烈,20∶00与8∶00的土壤湿度出现显著差异。在时间尺度上,随着降水的减少,北京市的土壤湿度在逐渐降低。在空间尺度上,北京市干旱范围在逐渐扩大,并且呈现以昌平为中心的极旱逐渐蔓延至多个区。由于顺义区土壤相对湿度较高,呈现另外一个以顺义为中心的土壤相对湿度逐渐变小的区域,但空间范围变化较小。
秦道清 , 赵岩 , 王红瑞 , 邓彩云 , 赵勇 . 基于站点观测和模式模拟的北京市土壤湿度[J]. 自然资源学报, 2019 , 34(1) : 191 -204 . DOI: 10.31497/zrzyxb20190116
It is of great significance to accurately and objectively evaluate the spatial and temporal variation characteristics of soil moisture in studies on the biochemical evolution process of the earth surface. Thus, the combination of model simulation and site observation is necessary to studying water and energy recycling at a regional scale especially. In this paper, based on daily soil surface (0-10 cm) moisture data of 82 monitoring stations in Beijing and GLDAS soil moisture products, the accuracy and consistency of CLDAS was evaluated and the spatio-temporal variability of soil moisture content in Beijing was examined. The root mean square error (RMSE) was used to identify the consistency of CLDAS products and observation values. Specifically, we compared and analyzed the accumulated values of CLDAS products and observation data in 1 day (8∶00, 20∶00), 7 days (8∶00, 20∶00), 15 days (8∶00, 20∶00), 31 days (8∶00, 20∶00), 61 days (8∶00, 20∶00), and 92 days (8∶00, 20∶00). The results showed that: (1) Although the data from CLDAS products were generally slightly higher than the measured data, CLDAS products and site observation data show a good consistency that RMSE in various countries was almost around 10; (2) CLDAS products could reflect the distribution characteristics of soil moisture in Beijing when the temperature was higher than 0 ℃, while there existed a bias in GLDAS products when the temperature was lower than 0 ℃; (3) Based on drought identification based on soil moisture data, we found that the drought area in Beijing was gradually expanding and one extreme drought center was spreading from Changping (soil relative moisture content < 30%) to other districts. Meanwhile, the other area with high soil relative humidity (soil relative moisture content > 50%), centered in Shunyi District, gradually decreased at a spatial scale; (4) In terms of temporal scale, soil moisture in Beijing gradually decreased with the decrease of precipitation that soil humidity at 20∶00 was all higher than that at 8∶00 in the same day (MEobs >0). When the temperature was lower than 0 ℃, soil humidity at 20∶00 and 8∶00 became significantly different. These conclusions would help us make effective use of GLDAS products in soil moisture related studies and would help us know the spatial and temporal variability of soil moisture content in Beijing.
Key words: soil moisture; CLDAS; site observation; model simulation; Beijing
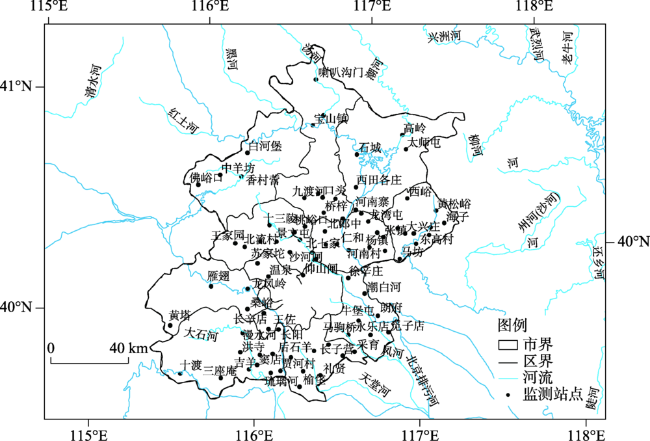
Fig. 1 Distribution of drought monitoring sites in Beijing图1 北京市旱情监测站点分布 |
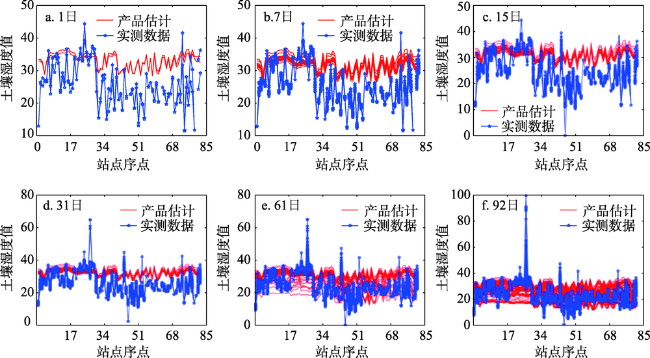
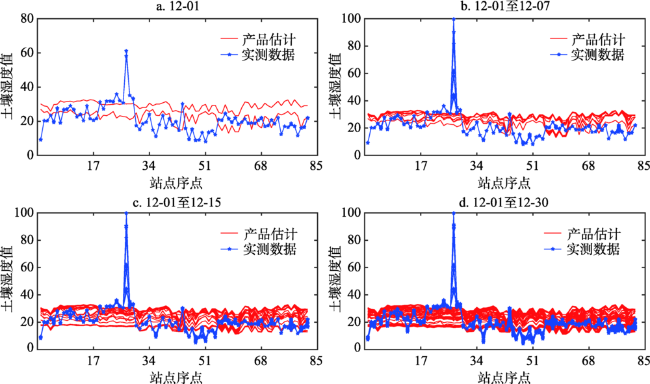
Fig. 2 The comparison of CLDAS products with observation data day by day图2 研究时间内CLDAS产品估计与实测累日对比 |
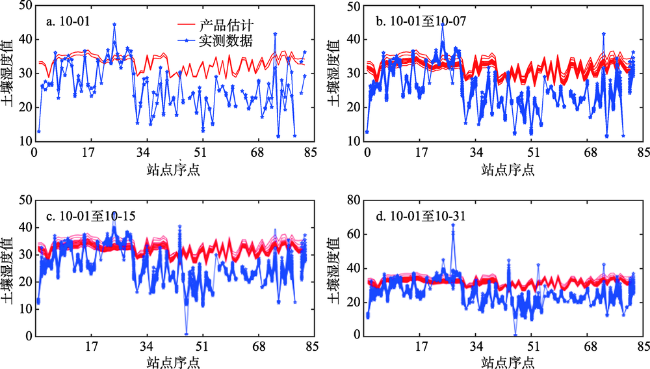
Fig. 3 The comparison of CLDAS products with observation data of October图3 10月份CLDAS产品估计与实测累日对比 |
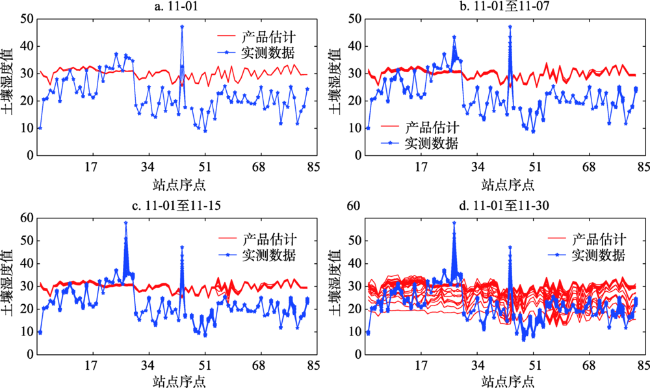
Fig. 4 The comparison of CLDAS products with observation data of November图4 11月份CLDAS产品估计与实测累日对比 |
Fig. 5 The comparison of CLDAS products with observation data of December图5 12月份CLDAS产品估计与实测累日对比 |
Fig. 6 The RMSE of CLDAS product and observation data of each site图6 各站点CLDAS产品与站点观测数据的RMSE |
Table 1 The average error of soil moisture at 20 o'clock and 8 o'clock in each district表1 各区县站点当日20∶00与8∶00土壤湿度平均误差比较 |
| 区县 | 实测 | 10月 | 0 ℃之前 | 0 ℃之后 |
|---|---|---|---|---|
| 朝阳 | 0.10 | 0.15 | 0.14 | -6.18 |
| 丰台 | -0.07 | 0.50 | 0.45 | -6.70 |
| 海淀 | 0.09 | 0.29 | 0.24 | -6.38 |
| 通州 | 0.13 | 0.43 | 0.31 | -7.33 |
| 大兴 | 0.07 | 0.40 | 0.01 | -8.62 |
| 顺义 | 0.06 | 0.31 | 0.16 | -6.83 |
| 房山 | 0.06 | 0.38 | 0.19 | -7.77 |
| 门头沟 | 0 | 0.41 | -0.12 | -6.89 |
| 昌平 | 0.06 | 0.32 | 0.23 | -6.27 |
| 延庆 | 0.07 | 0.25 | -1.07 | -5.97 |
| 怀柔 | 0.07 | 0.29 | -0.22 | -6.15 |
| 密云 | 0.01 | 0.28 | 0.12 | -6.53 |
| 平谷 | 0.07 | 0.24 | 0.15 | -6.89 |
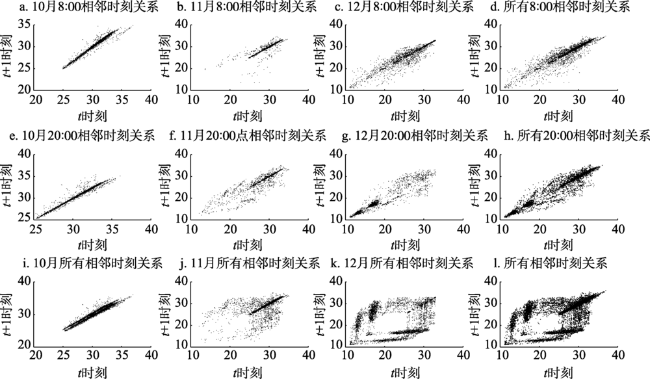
Fig. 7 The relation between CLADS product data with that of the previous day图7 CLADS产品数据相邻时刻关系 |
Table 2 The division by soil relative moisture and drought index表2 土壤相对湿度与干旱指数划分[12] |
| 干旱类型 | 土壤相对湿度范围 | 干旱影响程度 |
|---|---|---|
| 无旱 | >60% | 地表湿润或正常 |
| 轻旱 | 50%~60% | 地表蒸发量小,近地表空气干燥 |
| 中旱 | 40%~50% | 土壤表面干燥,地表植物叶片有萎蔫出现 |
| 重旱 | 30%~40% | 干土层较厚,地表植物萎蔫,叶片干枯 |
| 特旱 | <30% | 基本无土壤蒸发,地表植物干枯、死亡 |
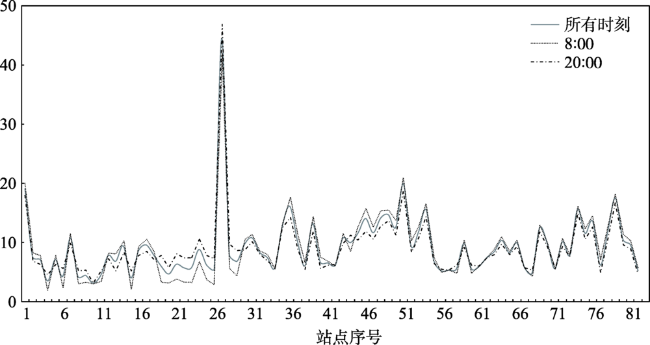
Table 3 The soil relative moisture at 8 o'clock and 20 o'clock during different time ranges表3 不同时间范围8∶00与20∶00的土壤相对湿度 |
| 时间范围 | 时刻 | 土壤相对湿度 |
|---|---|---|
| 所有时长 | 整体 | 0.3906 |
| 8∶00 | 0.3901 | |
| 20∶00 | 0.3911 | |
| 分期前 | 整体 | 0.4101 |
| 8∶00 | 0.4096 | |
| 20∶00 | 0.4105 | |
| 分期后 | 整体 | 0.3617 |
| 8∶00 | 0.3608 | |
| 20∶00 | 0.3621 | |
| 10月 | 整体 | 0.4247 |
| 8∶00 | 0.4245 | |
| 20∶00 | 0.4250 | |
| 11月 | 整体 | 0.3889 |
| 8∶00 | 0.3885 | |
| 20∶00 | 0.3892 | |
| 12月 | 整体 | 0.3582 |
| 8∶00 | 0.3573 | |
| 20∶00 | 0.3590 |
Fig. 8 Spatial interpolation variation of soil relative moisture in Beijing city图8 北京市土壤相对湿度空间插值变化 |
The authors have declared that no competing interests exist.
| [1] |
[
|
| [2] |
[
|
| [3] |
|
| [4] |
|
| [5] |
|
| [6] |
|
| [7] |
[
|
| [8] |
[
|
| [9] |
|
| [10] |
[
|
| [11] |
[
|
| [12] |
[
|
| [13] |
[
|
| [14] |
[
|
| [15] |
[
|
| [16] |
[
|
| [17] |
[
|
| [18] |
[
|
| [19] |
[
|
| [20] |
[
|
| [21] |
[
|
| [22] |
[
|
| [23] |
|
| [24] |
[
|
/
| 〈 |
|
〉 |
