
世界煤炭资源流动的时空格局及成因分析
作者简介:王诺(1954- ),男,辽宁大连人,博士,教授,博士生导师,研究方向为交通运输规划与管理。E-mail: wangnuodl@126.com
收稿日期: 2018-09-15
要求修回日期: 2019-01-10
网络出版日期: 2019-03-28
基金资助
国家海洋软科学项目(JJYX201612-1)
辽宁省社科基金重点项目(L15AJY014)
The temporal and spatial patterns and causes of coal resource flow in the world
Received date: 2018-09-15
Request revised date: 2019-01-10
Online published: 2019-03-28
Copyright
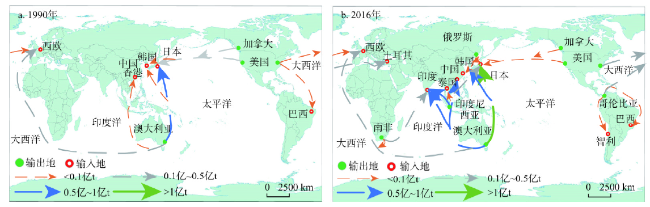
基于1990-2016年的统计数据,采用场理论研究世界煤炭资源流动的时空格局变化及其成因,揭示近30年来世界煤炭资源的流动状态及其演变过程。研究结果显示:(1)2016年世界煤炭的输出总量达12.25亿t,比1990年增加了10.13亿t,年均增长6.98%,其中澳大利亚、印尼和俄罗斯等是主要的煤炭输出国,印度、日本、中国和韩国是主要的煤炭输入国;(2)以场理论的位势、流场分布、流动迹线角度分析,世界煤炭资源的流动以北美洲、中南美洲和非洲为源流场,以欧洲及欧亚大陆、中东和亚太为汇流场,在澳大利亚—东亚、印尼—东亚/印度之间形成主要运输航线;(3)资源空间分布、供需匹配程度、空间距离、市场因素和国家政策等是煤炭资源流动的主要动因。研究发现:虽然中国煤炭储量丰富,但是煤炭消费数量庞大,仅可维持72年,必须重视煤炭的进口和储备工作。该研究对于中国科学制定产业政策具有重要价值。
王诺 , 张进 , 吴迪 , 赵伟杰 . 世界煤炭资源流动的时空格局及成因分析[J]. 自然资源学报, 2019 , 34(3) : 487 -500 . DOI: 10.31497/zrzyxb.20190304
Based on the statistical data from 1990 to 2016, this paper uses field theory to study the changes in the temporal and spatial pattern of coal resources in the world and their causes, revealing the flow of the world's coal resources and their evolution in the past 30 years. The results show that: (1) In 2016, the world's coal output reached 1.225 billion tons, an increase of 1.013 billion tons over 1990 and the average annual growth rate is 6.98%. Among them, Australia, Indonesia and Russia are the main exporters of coal, while India, Japan, China and South Korea are the main coal importers. (2) Analysis of the potential of the field theory, the distribution of the flow field and the angle of the flow trace, the flow of world's coal resources is the source flow in North America, Central and South America and Africa, with Europe and Eurasia, the Middle East and the Asia Pacific as the sinks flow field, and the major transport routes between Australia to East Asia, Indonesia to East Asia and India. (3) Spatial distribution of resources, matching degree of supply and demand, space distance, market factors and national policies are the main reasons for the flow of coal resources. The study found that although China's coal reserves are abundant, the amount of coal consumption is huge, and it can last for only 72 years, so we must attach importance to the import and storage of coal. This study is of great value to China in formulating industrial policies scientifically.
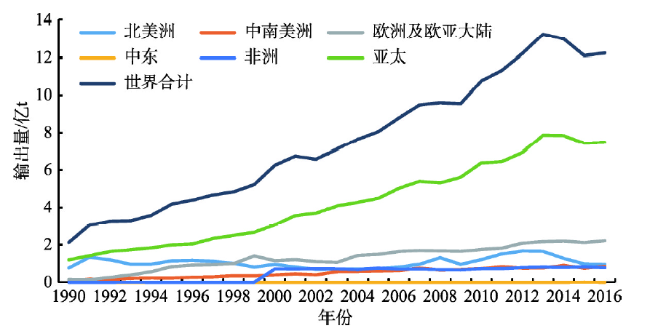
Fig. 1 Change of coal output in each region of the world图1 各地区煤炭输出变化 |
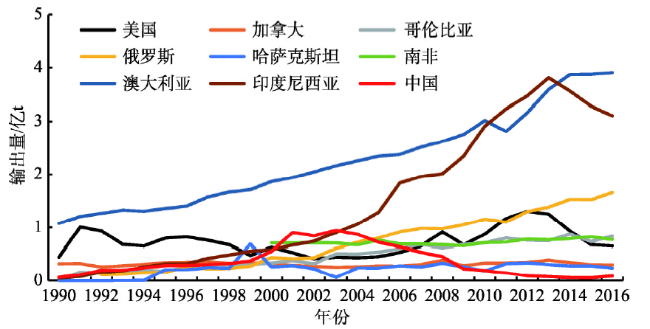
Fig. 2 Change of coal output in major countries图2 主要国家煤炭输出变化 |
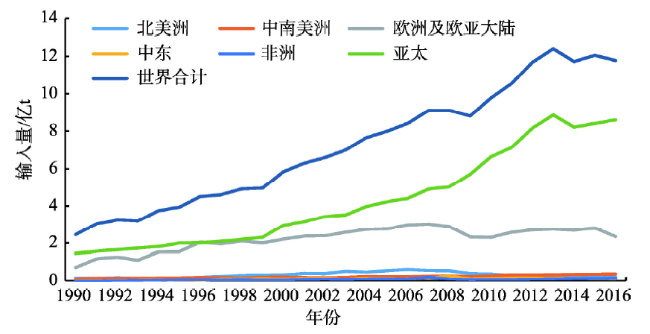
Fig. 3 Change of coal input in each region of the world图3 各地区煤炭输入变化 |
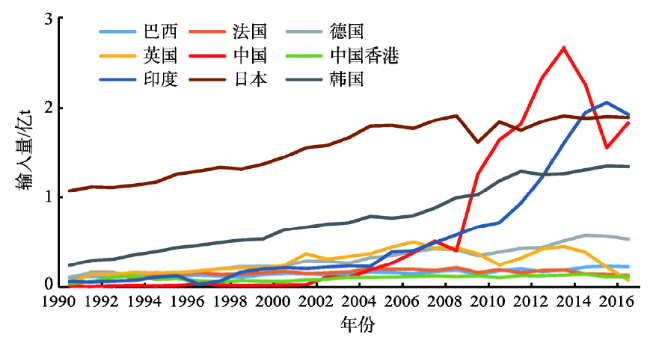
Fig. 4 Change of coal input in major countries and regions图4 主要国家和地区煤炭输入变化 |
Table 1 Coal flow ratio in each region of the world表1 各地区煤炭流动比 |
| 地区 | 流量/亿t | 年份 | |||||
|---|---|---|---|---|---|---|---|
| 1990 | 1995 | 2000 | 2005 | 2010 | 2016 | ||
| 北美洲 | 输出量/输入量 | 0.76/0.16 | 1.14/0.18 | 0.95/0.33 | 0.73/0.56 | 1.20/0.38 | 0.95/0.23 |
| 流动比 | 4.75 | 6.33 | 2.87 | 1.30 | 3.15 | 4.13 | |
| 中南美洲 | 输出量/输入量 | 0.02/0.10 | 0.22/0.17 | 0.39/0.21 | 0.60/0.23 | 0.72/0.28 | 0.85/0.38 |
| 流动比 | 0.20 | 1.29 | 1.85 | 2.60 | 2.57 | 2.23 | |
| 欧洲及欧亚大陆 | 输出量/输入量 | 0.14/0.72 | 0.83/1.55 | 1.15/2.19 | 1.48/2.76 | 1.74/2.29 | 2.21/2.33 |
| 流动比 | 0.19 | 0.53 | 0.52 | 0.53 | 0.75 | 0.94 | |
| 中东 | 输出量/输入量 | 0/0.01 | 0/0.03 | 0/0.10 | 0/0.11 | 0/0.12 | 0/0.11 |
| 流动比 | 0 | 0 | 0 | 0 | 0 | 0 | |
| 非洲 | 输出量/输入量 | -/- | -/- | 0.71/0.06 | 0.76/0.10 | 0.72/0.08 | 0.77/0.12 |
| 流动比 | - | - | 11.00 | 7.60 | 9.00 | 6.41 | |
| 亚太 | 输出量/输入量 | 1.19/1.45 | 1.99/1.99 | 3.06/2.95 | 4.49/4.23 | 6.38/6.63 | 7.47/8.60 |
| 流动比 | 0.82 | 1.00 | 1.03 | 1.06 | 0.96 | 0.86 | |
Table 2 Coal flow ratio in major countries表2 主要国家煤炭流动比 |
| 国家 | 流量/亿t | 年份 | |||||
|---|---|---|---|---|---|---|---|
| 1990 | 1995 | 2000 | 2005 | 2010 | 2016 | ||
| 美国 | 输出量/输入量 | 0.44/0.01 | 0.79/0.07 | 0.63/0.11 | 0.45/0.28 | 0.87/0.17 | 0.65/0.09 |
| 流动比 | 44.00 | 11.28 | 5.72 | 1.60 | 5.11 | 7.22 | |
| 哥伦比亚 | 输出量/输入量 | 0.02/0 | 0.18/0 | 0.34/0 | 0.54/0 | 0.71/0 | 0.83/0 |
| 流动比 | ^ | ^ | ^ | ^ | ^ | ^ | |
| 德国 | 输出量/输入量 | 0.05*/0.11* | 0.01/0.15 | 0.01/0.23 | 0.01/0.35 | 0.01/0.39 | 0.06/0.53 |
| 流动比 | 0.45 | 0.06 | 0.04 | 0.02 | 0.02 | 0.11 | |
| 俄罗斯 | 输出量/输入量 | -/- | 0.16/- | 0.44/0.26 | 0.80/0.22 | 1.16/0.16 | 1.66/0.20 |
| 流动比 | - | - | 1.69 | 3.63 | 7.25 | 8.30 | |
| 南非 | 输出量/输入量 | -/- | -/- | 0.70/0.01 | 0.75/0.02 | 0.71/0 | 0.77/0.02 |
| 流动比 | - | - | 70.00 | 37.50 | ^ | 38.50 | |
| 澳大利亚 | 输出量/输入量 | 1.08/0 | 1.36/0 | 1.87/0 | 2.34/0 | 3.02/0 | 3.91/0 |
| 流动比 | ^ | ^ | ^ | ^ | ^ | ^ | |
| 中国 | 输出量/输入量 | 0.06/0.01 | 0.29/0.02 | 0.55/0.02 | 0.72/0.26 | 0.19/1.65 | 0.09/1.83 |
| 流动比 | 6.00 | 14.50 | 27.50 | 2.76 | 0.11 | 0.04 | |
| 印度 | 输出量/输入量 | 0/0.06 | 0/0.13 | 0.02/0.21 | 0.02/0.39 | 0.01/0.72 | 0.01/1.93 |
| 流动比 | 0 | 0 | 0.09 | 0.05 | 0.01 | 0 | |
| 印尼 | 输出量/输入量 | 0.04/0 | 0.32/0 | 0.58/0 | 1.29/0 | 2.91/0 | 3.11/0 |
| 流动比 | ^ | ^ | ^ | ^ | ^ | ^ | |
| 日本 | 输出量/输入量 | 0/1.08 | 0/1.26 | 0/1.45 | 0/1.81 | 0/1.85 | 0/1.90 |
| 流动比 | 0 | 0 | 0 | 0 | 0 | 0 | |
| 韩国 | 输出量/输入量 | 0/0.24 | 0/0.44 | 0/0.64 | 0/0.77 | 0/1.19 | 0/1.35 |
| 流动比 | 0 | 0 | 0 | 0 | 0 | 0 | |
注:*为联邦德国的数据;^表示无穷大;“-”表示无当年数据,下同。 |
Fig. 5 Comparison of the change of coal supply and demand potential in major countries图5 煤炭供需位势变化对比 |
Table 3 The main source of coal flow and flow direction表3 煤炭主要源地流量及流向 |
| 源地 | 1990年 | 2016年 | |||
|---|---|---|---|---|---|
| 输出量/亿t | 输入国家 | 输出量/亿t | 输入国家 | ||
| 美国 | 0.44 | 日本、加拿大、巴西 | 0.65 | 荷兰、巴西、印度、日本 | |
| 加拿大 | 0.32 | 日本、韩国 | 0.30 | 日本、韩国、中国、印度 | |
| 哥伦比亚 | 0.02 | 西班牙、葡萄牙、芬兰 | 0.83 | 土耳其、荷兰、美国 | |
| 波兰 | 0.08 | 芬兰、联邦德国 | 0.09 | 捷克、德国 | |
| 俄罗斯 | - | - | 1.66 | 韩国、日本、中国 | |
| 哈萨克斯坦 | - | - | 0.24 | 俄罗斯 | |
| 南非 | - | - | 0.77 | 印度 | |
| 澳大利亚 | 1.08 | 韩国 | 3.91 | 日本、中国、韩国、印度 | |
| 中国 | 0.06 | 日本 | 0.09 | 韩国、日本 | |
| 印尼 | 0.04 | 日本、马来西亚、中国香港 | 3.11 | 印度、中国、韩国、日本 | |
| 合计 | 2.04 | 11.65 | |||
| 占世界比例/% | 96.16 | 95.10 | |||
Table 4 The main sinks of coal flow and flow direction in major countries表4 煤炭主要汇地流量及流向 |
| 汇地 | 1990年 | 2016年 | |||
|---|---|---|---|---|---|
| 输入量/亿t | 输出国家 | 输入量/亿t | 输出国家 | ||
| 巴西 | 0.10 | 美国、波兰、澳大利亚、加拿大 | 0.22 | 澳大利亚、美国、哥伦比亚 | |
| 法国 | 0.05 | 澳大利亚 | 0.13 | 澳大利亚、俄罗斯、哥伦比亚、南非 | |
| 意大利 | ^ | 澳大利亚 | 0.17 | 俄罗斯、哥伦比亚、南非、美国 | |
| 德国 | 0.11 | 波兰、澳大利亚 | 0.53 | 俄罗斯、哥伦比亚、美国、澳大利亚 | |
| 荷兰 | 0.07 | 澳大利亚 | 0.29 | 哥伦比亚、俄罗斯、德国、美国 | |
| 英国 | 0.05 | 澳大利亚 | 0.08 | 哥伦比亚、俄罗斯 | |
| 中国 | 0.01 | 澳大利亚 | 1.83 | 澳大利亚、印尼、蒙古、朝鲜、俄罗斯 | |
| 印度 | 0.06 | 澳大利亚 | 1.93 | 印尼、澳大利亚、南非 | |
| 日本 | 1.08 | 澳大利亚、加拿大、美国 | 1.90 | 澳大利亚、印尼、俄罗斯 | |
| 韩国 | 0.24 | 澳大利亚、加拿大、美国 | 1.35 | 澳大利亚、印尼、俄罗斯 | |
| 合计 | 1.77 | 8.43 | |||
| 占世界比例/% | 72.54 | 71.56 | |||
Fig. 6 Distribution of coal flow field in each region of the world图6 煤炭流场分布 |
Fig. 7 Coal shipping route evolution图7 煤炭海运航线演变 |
Fig. 8 Distribution of coal resources in various regions图8 各地区煤炭资源分布 |
Table 5 Coal reserves in major countries表5 主要国家煤炭储量 |
| 国家 | 无烟煤和烟煤 | 次烟煤和褐煤 | 储量合计/亿t | 占世界份额/% | 储采比/年 |
|---|---|---|---|---|---|
| 美国 | 2214 | 301.82 | 2515.82 | 22.08 | 381 |
| 中国 | 2300.04 | 140.06 | 2440.10 | 21.42 | 72 |
| 俄罗斯 | 696.34 | 907.30 | 1603.64 | 14.08 | 417 |
| 澳大利亚 | 683.10 | 765.08 | 1448.18 | 12.71 | 294 |
| 印度 | 897.82 | 49.87 | 947.69 | 8.32 | 137 |
| 德国 | 0.12 | 362.00 | 362.12 | 3.18 | 206 |
| 乌克兰 | 320.39 | 23.36 | 343.75 | 3.02 | >500 |
| 哈萨克斯坦 | 256.05 | - | 256.05 | 2.25 | 250 |
| 印尼 | 173.26 | 82.47 | 255.73 | 2.24 | 59 |
| 波兰 | 187.00 | 54.61 | 241.61 | 2.12 | 184 |
| 合计 | 7728.12 | 2686.57 | 10414.69 | 91.41 | |
| 世界合计 | 8162.14 | 3231.17 | 11393.31 | 100.00 | 153 |
注:根据《世界能源统计年鉴2017》整理。 |
Table 6 Changes of coal supply and demand in various regions表6 各地区煤炭供需变化 |
| 地区 | 1990年 | 2016年 | |||||||
|---|---|---|---|---|---|---|---|---|---|
| 生产 /亿t | 占世界 份额/% | 消费 /亿t | 占世界 份额/% | 生产 /亿t | 占世界 份额/% | 消费 /亿t | 占世界 份额/% | ||
| 北美洲 | 10.09 | 21.15 | 8.50 | 18.67 | 7.29 | 9.77 | 7.05 | 9.45 | |
| 中南美洲 | 0.30 | 0.64 | 0.31 | 0.69 | 1.02 | 1.36 | 0.69 | 0.93 | |
| 欧洲及欧亚大陆 | 19.17 | 40.18 | 19.19 | 42.14 | 11.62 | 15.58 | 11.63 | 15.59 | |
| 中东 | 0.01 | 0.02 | 0.06 | 0.14 | 0.02 | 0.02 | 0.19 | 0.25 | |
| 非洲 | 1.83 | 3.83 | 1.34 | 2.94 | 2.64 | 3.54 | 1.70 | 2.28 | |
| 亚太 | 16.31 | 34.19 | 16.13 | 35.43 | 52.02 | 69.73 | 53.34 | 71.51 | |
Table 7 Changes of coal supply and demand in major countries表7 主要国家煤炭供需变化 |
| 国家 | 1990年 | 2016年 | |||||||
|---|---|---|---|---|---|---|---|---|---|
| 生产 /亿t | 占世界 份额/% | 消费 /亿t | 占世界 份额/% | 生产 /亿t | 占世界 份额/% | 消费 /亿t | 占世界 份额/% | ||
| 美国 | 9.34 | 19.57 | 7.97 | 17.50 | 6.61 | 8.86 | 6.49 | 8.70 | |
| 德国 | 4.27 | 8.96 | 4.22 | 9.26 | 1.76 | 2.36 | 2.41 | 3.24 | |
| 波兰 | 2.15 | 4.51 | 1.69 | 3.72 | 1.31 | 1.76 | 1.05 | 1.41 | |
| 俄罗斯 | - | - | - | - | 3.85 | 5.17 | 1.77 | 2.37 | |
| 南非 | 1.75 | 3.66 | 1.18 | 2.58 | 2.51 | 3.37 | 1.49 | 1.99 | |
| 澳大利亚 | 2.13 | 4.47 | 0.63 | 1.38 | 4.93 | 6.61 | 0.72 | 0.97 | |
| 中国 | 10.80 | 22.64 | 10.05 | 22.06 | 34.11 | 45.72 | 35.95 | 48.20 | |
| 印度 | 2.23 | 4.68 | 2.31 | 5.06 | 6.92 | 9.28 | 8.66 | 11.60 | |
| 印尼 | 0.11 | 0.22 | 0.07 | 0.15 | 4.34 | 5.82 | 1.26 | 1.69 | |
| 日本 | 0.08 | 0.17 | 1.41 | 3.10 | 0.01 | 0.02 | 2.18 | 2.92 | |
| 韩国 | 0.17 | 0.36 | 0.49 | 1.07 | 0.02 | 0.02 | 1.64 | 2.20 | |
Table 8 Changes in coal output in Australia表8 澳大利亚煤炭输出量变化情况 |
| 年份 | 亚太 | 欧洲及欧亚大陆 | 中南美洲 | 其他 | |||||||
|---|---|---|---|---|---|---|---|---|---|---|---|
| 输入量/亿t | 比例/% | 输入量/亿t | 比例/% | 输入量/亿t | 比例/% | 输入量/亿t | 比例/% | ||||
| 2012 | 2.94 | 91.19 | 0.19 | 5.89 | 0.04 | 1.19 | 0.06 | 1.73 | |||
| 2013 | 3.35 | 93.13 | 0.18 | 4.91 | 0.04 | 1.24 | 0.03 | 0.72 | |||
| 2014 | 3.59 | 92.53 | 0.19 | 4.95 | 0.06 | 1.61 | 0.03 | 0.90 | |||
| 2015 | 3.50 | 90.27 | 0.23 | 5.99 | 0.10 | 2.47 | 0.05 | 1.27 | |||
| 2016 | 3.53 | 90.21 | 0.23 | 5.89 | 0.11 | 2.74 | 0.05 | 1.17 | |||
注:资料来源根据UN Comtrade Database数据整理。 |
The authors have declared that no competing interests exist.
| [1] |
[
|
| [2] |
[
|
| [3] |
[
|
| [4] |
[
|
| [5] |
[
|
| [6] |
[
|
| [7] |
[
|
| [8] |
[
|
| [9] |
|
| [10] |
[
|
| [11] |
[
|
| [12] |
[
|
| [13] |
[
|
| [14] |
[
|
| [15] |
|
| [16] |
|
| [17] |
[
|
| [18] |
[
|
/
| 〈 |
|
〉 |

