
基于临近台站气象数据的参考作物蒸散量估算方法
作者简介:张学梅(1993- ),女,甘肃民勤人,硕士,主要从事草地节水灌溉方面的研究。E-mail: zhangxm16@lzu.edu.cn
收稿日期: 2018-06-22
要求修回日期: 2018-09-26
网络出版日期: 2019-01-20
基金资助
国家重点研发计划项目(2016YFC04003)
国家自然科学基金项目(51609112)
国家牧草产业技术体系(CARS-34)
Comparison of different methods for estimating reference evapotranspiration with weather data from nearby stations
Received date: 2018-06-22
Request revised date: 2018-09-26
Online published: 2019-01-20
Copyright
参考作物蒸散量(ET0)是评估区域植被耗水进而指导水资源优化管理所需的主要参数之一,但我国大部分地区标准化气象台站稀疏、部分研究点的气象资料通常难以获取,给ET0的计算带来了很大困难。以地处内陆旱区的内蒙古河套灌区为例,利用该区4个标准气象站1981-2006年的气象资料,讨论了研究点在没有历史气象数据且现有气象数据不完备的情况下,采用临近台站气象数据估算ET0的可靠性。估算方法分别为估算未知气象数据的FAO56 Penman-Monteith方程(PM56)、基于临近台站气象数据校正的经验公式以及利用临近台站气象数据训练的人工神经网络模型。结果表明:(1)在完全没有气象数据的条件下,可采用临近站点的气象数据估算研究点的ET0,平均绝对误差(MAE)为0.43~0.52 mm d-1,均方根误差(RMSE)为0.56~0.63 mm d-1;估算精度与台站间的距离有关,利用维度信息校正太阳辐射值可提高估算精度。(2)仅有最高和最低气温数据时,估算气象数据的PM56方程计算误差较大,且站点之间表现不稳定,人工神经网络模型的估算精度最高,MAE和RMSE分别为0.14~0.22 mm d-1和0.17~0.29 mm d-1;校正后的Hargreaves公式的估算效果次之,MAE和RMSE分别为0.23~0.26 mm d-1和0.30~0.31 mm d-1。(3)在已知温度和辐射数据时,利用临近台站气象数据训练的人工神经网络模型依然表现最好,MAE和RMSE分别为0.13~0.19 mm d-1和0.17~0.25 mm d-1,其他两种方法误差较大。在内陆干旱条件下,利用研究点的气温数据结合临近台站的历史气象信息可有效估算参考作物蒸散发。
张学梅 , 王自奎 , 沈禹颖 , 杨惠敏 . 基于临近台站气象数据的参考作物蒸散量估算方法[J]. 自然资源学报, 2019 , 34(1) : 179 -190 . DOI: 10.31497/zrzyxb.20190115
Potential evapotranspiration (ET0) is one of the most critical parameters that are essential for evaluating regional vegetation water use and managing water and soil resources. However, accurate estimation of it is so difficult for many parts of China due to a limited number of weather stations. Weather data from nearby stations are available for most sites, but past relevant works mainly focused on ET0 predicting methods with local weather data and less work was done to investigate the approaches for estimating ET0 with data from other stations. Therefore, this study was conducted to test the reliability of estimating ET0 with weather information from nearby stations. Whether data of four weather stations located in Hetao Irrigation District of western Inner Mongolia were collected. The study area has an arid climate with annual rainfall and pan evaporation of 130-215 and 2100-2300 mm respectively. Three commonly used approaches, namely, FAO56 Penman-Monteith equation (PM56) with estimated weather data, the empirical formula corrected with meteorological data of nearby stations, and the artificial neural network model (ANN) developed using meteorological data from nearby stations, were compared for predicting ET0 when data are limited in this work. The results showed that: (1) When all of the necessary parameters were not measured at the study sites, weather data from nearby stations could be used directly, the average absolute error (MAE) of the ET0 calculation was 0.43-0.52 mm d-1, and the root mean square error (RMSE) was 0.56-0.63 mm d-1, and the error could be narrowed by correcting the radiation data using the latitude information of the stations; (2) When the maximum and minimum air temperature data were available, PM56 with estimated weather data performed the worst, and the performance of the ANN model is the best with the MAE and RMSE ranging between 0.14-0.22 mm d-1 and 0.17-0.29 mm d-1, respectively; and the results of the calibrated Hargreaves formula are intermediate with the MAE and RMSE values of 0.23-0.26 mm d-1 and 0.30-0.31 mm d-1, respectively; (3) When knowing the temperature and radiation data, the ANN model trained with meteorological data from nearby stations is still the best, with MAE and RMSE values of 0.13-0.19 mm d-1 and 0.17-0.25 mm d-1, respectively, and the other two methods have larger error and the performance is inconsistent among different stations. The results of this study demonstrated that we can estimated ET0 accurately using air temperature data in combination with weather data of nearby stations under arid conditions, and the reliability of the methods still need to be validated under other climatic conditions.
Table 1 Location and annual mean meteorological information of the selected stations during 1981-2006表1 1981-2006年各气象站的地理位置及气候资料多年均值 |
| 站点 | 纬度/°N | 经度 /°E | 最高气温 /°C | 最低气温 /°C | 湿度 RH/% | 风速 U2/m s-1 | 日照时数 /h | 年降雨 /mm | ET0 /mm d-1 |
|---|---|---|---|---|---|---|---|---|---|
| 磴口 | 40.3 | 107.0 | 15.8 | 2.7 | 47.7 | 2.61 | 8.97 | 144.0 | 3.53 |
| 杭锦后旗 | 40.9 | 107.2 | 14.6 | 1.5 | 50.3 | 2.02 | 8.68 | 135.1 | 3.16 |
| 乌拉特前旗 | 40.8 | 108.6 | 15.1 | 1.6 | 48.8 | 2.84 | 8.68 | 213.3 | 3.54 |
| 五原 | 41.1 | 108.3 | 14.5 | 1.6 | 51.7 | 1.88 | 8.77 | 173.6 | 3.11 |
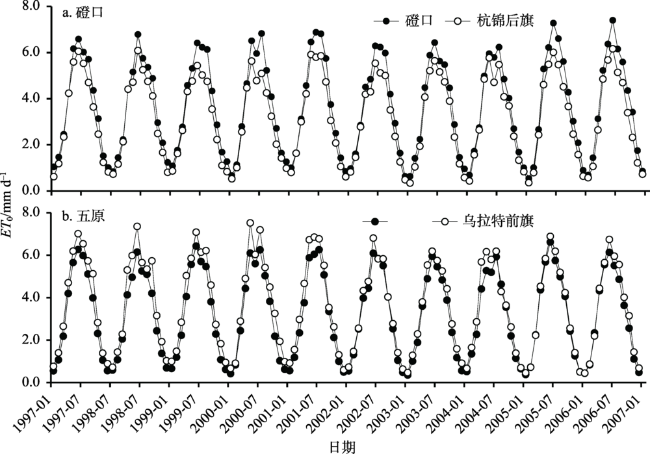
Fig. 1 Comparison of measured and estimated ET0 when no weather data existed at both study sites图1 磴口站和五原站没有气象数据时ET0实测值和估算值的比较 |
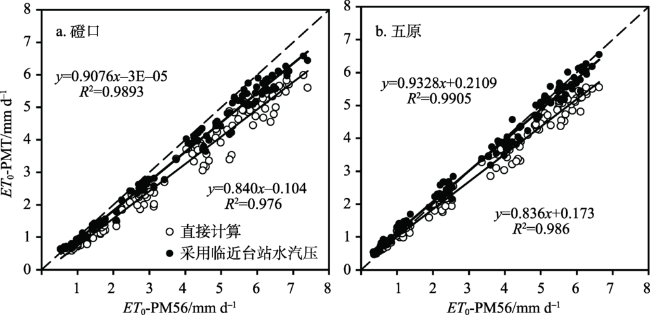
Fig. 2 Comparisons of measured and calculated ET0 with estimated weather parameters when only air temperature existed at both study sites (a, DK; b, WY)图2 磴口站和五原站仅有温度数据时用估算气象数据法计算的ET0值(ET0-PMT)与实测值(ET0-PM56)的比较 |
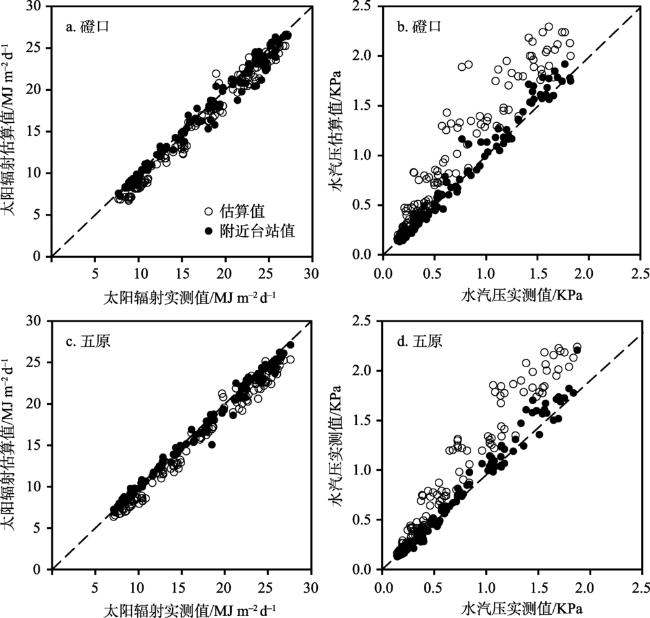
Fig. 3 Comparisons of measured and estimated solar radiation (a and c) and water pressure (b and d) for DK (a and b) and WY (c and d) stations图3 磴口站和五原站太阳辐射(a和c)和水汽压(b和d)估算值和真实值的比较 |
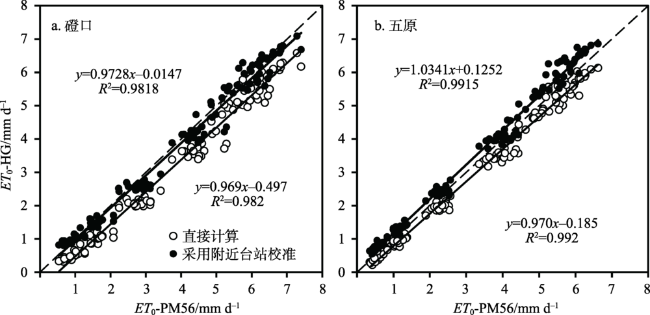
Fig. 4 Comparison of measured and calculated ET0 with Hargreaves equation when only air temperature existed at both study sites (a, DK; b, WY)图4 磴口站和五原站仅有温度数据时用Hargreaves公式计算的ET0值(ET0-HG)与实测值(ET0-PM56)的比较 |
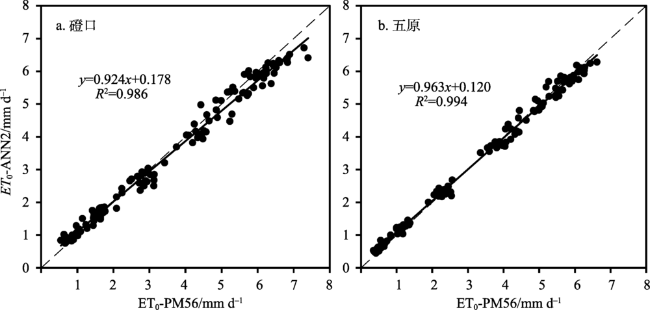
Fig. 5 Comparison of measured and calculated ET0 with ANN model when only air temperature existed at both study sites (a, DK; b, WY)图5 磴口站和五原站仅有温度数据时用ANN计算的ET0值(ET0-ANN2)与实测值(ET0-PM56)的比较 |
The authors have declared that no competing interests exist.
| [1] |
[
|
| [2] |
[
|
| [3] |
[
|
| [4] |
[
|
| [5] |
|
| [6] |
|
| [7] |
[
|
| [8] |
[
|
| [9] |
[
|
| [10] |
[
|
| [11] |
[
|
| [12] |
|
| [13] |
|
| [14] |
|
| [15] |
|
| [16] |
|
| [17] |
[
|
| [18] |
|
| [19] |
[
|
| [20] |
|
| [21] |
|
| [22] |
[
|
| [23] |
|
| [24] |
|
| [25] |
|
| [26] |
[
|
| [27] |
[
|
| [28] |
|
| [29] |
|
| [30] |
|
| [31] |
|
/
| 〈 |
|
〉 |