
公平与效率协调视角下的中国碳减排潜力与路径
作者简介:周迪(1988- ),男,湖北鄂州人,博士,讲师,研究方向为区域经济、区域资源配置。 E-mail: zhoudi19880101@163.com
收稿日期: 2018-06-25
要求修回日期: 2018-09-27
网络出版日期: 2019-01-20
基金资助
全国统计科学研究一般项目(2017LY55)
广东省自然科学基金博士启动项目(2018A030310044)
广东省软科学项目重点项目(2015A070703019)
广东省软科学项目(2016A070705058)
The potentialities and paths of China's carbon emission reduction based on the coordination of fairness and efficiency
Received date: 2018-06-25
Request revised date: 2018-09-27
Online published: 2019-01-20
Copyright
在碳排放公平原则和效率原则协调的基础上计算区域碳减排潜力并设计碳减排路径,对于我国更科学地测算区域碳减排潜力以及更合理地制定区域碳减排路径,从而更好地促进绿色低碳经济发展具有重要意义。选取了1997-2015年29个省级地区数据,通过Super-SBM模型测算了碳排放效率,并以人均碳排放量衡量区域碳排放公平;基于Markov链框架测算了碳排放公平和效率的俱乐部趋同指数,以分析公平和效率原则在考察我国碳减排潜力中的重要性以及在制定碳减排政策时的侧重点,进而在碳排放公平与效率协调的视角下重新测算出各省份的碳减排潜力;在碳排放公平和效率二维矩阵图基础上,基于二者协调的视角设计了碳减排路径。研究发现:(1)我国碳排放公平与碳排放效率的俱乐部趋同程度(固化程度)具有显著差异,碳排放的“长期低效率”比“长期不公平”固化问题更严重。(2)相比于公平与效率相等原则,基于协调原则下的各地区碳减排潜力指数存在变化,这将影响我国碳减排目标地区的划分,进而影响国家碳权分配以及减排责任的分摊。(3)基于各省碳减排的公平性与效率性差异,中国大陆29个省级行政区域可划分为四大类型地区。我国公平效率协调的减排路径是:重点支持“低效低排”型地区,提高其碳排放效率,实施碳排放公平和效率动态协调的碳减排策略。
关键词: 碳减排潜力; 碳减排路径; Super-SBM模型; Markov链模型; 俱乐部趋同指数
周迪 , 郑楚鹏 , 华诗润 , 黄宇森 . 公平与效率协调视角下的中国碳减排潜力与路径[J]. 自然资源学报, 2019 , 34(1) : 80 -91 . DOI: 10.31497/zrzyxb.20190107
Studying the Chinese provincial carbon emission reduction potential and the path of emission reduction based on the coordinated perspective of fairness and efficiency is most significant to measuring the regional potential of carbon emission reduction and to formulating the regional carbon emission reduction path for China, so as to better promote the development of green low carbon economy. First, we measure the carbon reduction efficiency by the Super-SBM model, and measure the equity of regional carbon emissions by per capita carbon emissions. Then we calculate the carbon club convergence index of efficiency and fairness based on Markov model frame so as to analyze the importance of carbon reduction potential in China and the emphasis in carbon emissions. Then we recalculate the carbon emission potential of each province based on the coordinated principle of fairness and efficiency. Finally, the carbon emission reduction path is designed on the basis of the two dimensional matrix diagram of carbon emission fairness and efficiency based on the coordinated principle. The results show that: (1) The carbon club convergence degree of China's regional carbon emission efficiency is higher, and the curing problem of "long-term low efficiency" of carbon emissions is more serious than the "long-term unfair". (2) China's carbon emission potential is underestimated, which will affect the country's allocation of carbon rights and the sharing of emission reduction responsibility. (3) Based on the coordinated perspective of fairness and efficiency in carbon emissions, the 29 provincial-level administrative districts in the mainland of China fall into four categories. Policymakers should focus on supporting the regions of "low-efficiency & low-emission" type and improve the efficiency of their carbon emissions, so as to achieve carbon emission reduction under the coordinated perspective of fairness and efficiency.
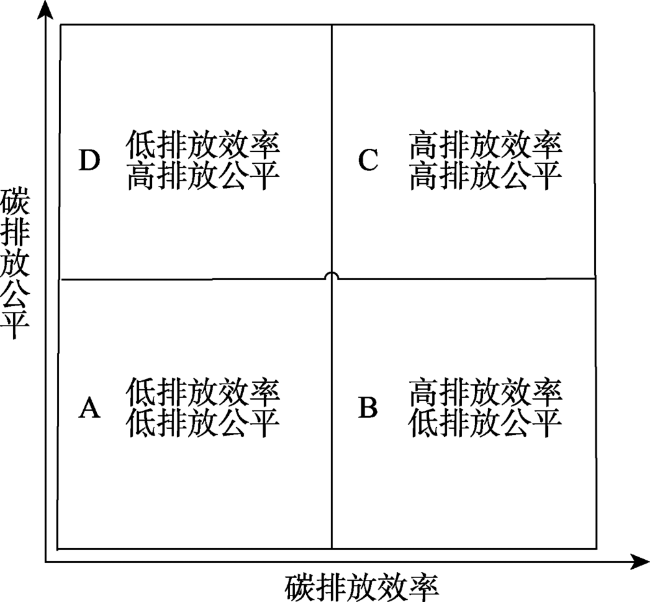
Fig. 1 "Fair-efficiency" matrix for carbon emission reduction图1 碳减排“公平—效率”矩阵图 |
Table 1 The Markov transfer probability result of carbon emission fairness and efficiency in China表1 我国碳排放公平与排放效率的Markov转移概率结果 |
| 时长 (a) | 类型 | 碳排放公平 | 碳排放效率 | |||||||||
|---|---|---|---|---|---|---|---|---|---|---|---|---|
| n | L | ML | MH | H | n | L | ML | MH | H | |||
| 1 | L | 117 | 0.8803 | 0.1197 | 0.0000 | 0.0000 | 144 | 0.9514 | 0.0486 | 0.0000 | 0.0000 | |
| ML | 135 | 0.0889 | 0.8444 | 0.0667 | 0.0000 | 108 | 0.1111 | 0.7778 | 0.1111 | 0.0000 | ||
| MH | 101 | 0.0000 | 0.0891 | 0.8119 | 0.0990 | 125 | 0.0000 | 0.0960 | 0.8720 | 0.0320 | ||
| H | 169 | 0.0000 | 0.0000 | 0.0710 | 0.9290 | 145 | 0.0000 | 0.0000 | 0.0207 | 0.9793 | ||
| 3 | L | 104 | 0.7788 | 0.2019 | 0.0192 | 0.0000 | 126 | 0.9286 | 0.0714 | 0.0000 | 0.0000 | |
| ML | 120 | 0.1500 | 0.7167 | 0.1167 | 0.0167 | 98 | 0.2347 | 0.5714 | 0.1939 | 0.0000 | ||
| MH | 92 | 0.0109 | 0.1739 | 0.6413 | 0.1739 | 113 | 0.0000 | 0.1681 | 0.7345 | 0.0973 | ||
| H | 148 | 0.0000 | 0.0068 | 0.1351 | 0.8581 | 127 | 0.0000 | 0.0000 | 0.0630 | 0.9370 | ||
| 5 | L | 92 | 0.6957 | 0.2826 | 0.0217 | 0.0000 | 108 | 0.9074 | 0.0926 | 0.0000 | 0.0000 | |
| ML | 104 | 0.1827 | 0.6538 | 0.1442 | 0.0192 | 88 | 0.2841 | 0.4432 | 0.2614 | 0.0114 | ||
| MH | 79 | 0.0253 | 0.1772 | 0.5316 | 0.2658 | 101 | 0.0198 | 0.2178 | 0.6139 | 0.1485 | ||
| H | 131 | 0.0076 | 0.0153 | 0.1908 | 0.7863 | 109 | 0.0000 | 0.0000 | 0.0826 | 0.9174 | ||
注:分别以L、ML、MH、H代表低水平、中低水平、中高水平和高水平4个组别,n代表样本数。 |
Table 2 Estimation of carbon emission reduction potential in all provinces of China based on the perspective of coordination of fairness and efficiency表2 碳排放公平与效率协调协调视角下中国各省份碳减排潜力指数测算 |
| 地区 | 1997年 | 2015年 | ||||
|---|---|---|---|---|---|---|
| 公平效率协调原则 | 公平效率 相等原则 | 两原则 的差值 | 公平效率 协调原则 | 公平效率 相等原则 | 两原则 的差值 | |
| 北京 | 0.6519 | 0.6497 | +0.0022 | 0.1278 | 0.1241 | +0.0037 |
| 天津 | 0.4793 | 0.4811 | -0.0018 | 0.4323 | 0.4261 | +0.0062 |
| 河北 | 0.5325 | 0.5265 | +0.0060 | 0.6053 | 0.5967 | +0.0086 |
| 山西 | 0.9552 | 0.9565 | -0.0013 | 0.8149 | 0.8105 | +0.0044 |
| 内蒙古 | 0.6463 | 0.6404 | +0.0059 | 0.9805 | 0.9811 | -0.0006 |
| 辽宁 | 0.2242 | 0.2312 | -0.0070 | 0.1531 | 0.1579 | -0.0048 |
| 吉林 | 0.5591 | 0.5519 | +0.0072 | 0.5479 | 0.5376 | +0.0103 |
| 黑龙江 | 0.5794 | 0.5710 | +0.0084 | 0.5342 | 0.5237 | +0.0105 |
| 上海 | 0.3999 | 0.4117 | -0.0118 | 0.1339 | 0.1349 | -0.0010 |
| 江苏 | 0.4119 | 0.4052 | +0.0067 | 0.5299 | 0.5215 | +0.0084 |
| 浙江 | 0.3627 | 0.3574 | +0.0053 | 0.4833 | 0.4736 | +0.0097 |
| 安徽 | 0.4865 | 0.4749 | +0.0116 | 0.5247 | 0.5136 | +0.0111 |
| 福建 | 0.0717 | 0.0706 | +0.0011 | 0.3882 | 0.3804 | +0.0078 |
| 江西 | 0.4496 | 0.4371 | +0.0125 | 0.5404 | 0.5271 | +0.0133 |
| 山东 | 0.4488 | 0.4409 | +0.0079 | 0.5962 | 0.5876 | +0.0086 |
| 河南 | 0.4786 | 0.4669 | +0.0117 | 0.5722 | 0.5597 | +0.0125 |
| 湖北 | 0.4873 | 0.4775 | +0.0098 | 0.4902 | 0.4794 | +0.0108 |
| 湖南 | 0.4554 | 0.4438 | +0.0116 | 0.4836 | 0.4717 | +0.0119 |
| 广东 | 0.4416 | 0.4328 | +0.0088 | 0.4894 | 0.4769 | +0.0125 |
| 广西 | 0.3915 | 0.3800 | +0.0115 | 0.5035 | 0.4908 | +0.0127 |
| 重庆 | 0.4277 | 0.4175 | +0.0102 | 0.4232 | 0.4140 | +0.0092 |
| 四川 | 0.5082 | 0.4948 | +0.0134 | 0.5093 | 0.4961 | +0.0132 |
| 贵州 | 0.6080 | 0.5957 | +0.0123 | 0.6244 | 0.6127 | +0.0117 |
| 云南 | 0.1226 | 0.1215 | +0.0011 | 0.1939 | 0.1907 | +0.0032 |
| 陕西 | 0.4955 | 0.4849 | +0.0106 | 0.6367 | 0.6271 | +0.0096 |
| 甘肃 | 0.4947 | 0.4836 | +0.0111 | 0.5534 | 0.5414 | +0.0120 |
| 青海 | 0.5296 | 0.5179 | +0.0117 | 0.6016 | 0.5899 | +0.0117 |
| 宁夏 | 0.5622 | 0.5561 | +0.0061 | 0.9435 | 0.9434 | +0.0001 |
| 新疆 | 0.5753 | 0.5665 | +0.0088 | 0.7474 | 0.7400 | +0.0074 |
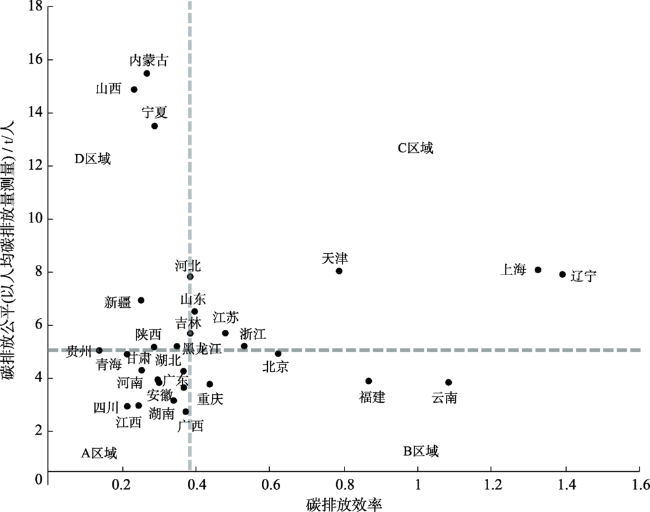
Fig. 2 "Fair-efficiency" matrix for carbon emission reduction图2 碳减排“公平—效率”矩阵图 |
The authors have declared that no competing interests exist.
| [1] |
|
| [2] |
|
| [3] |
[
|
| [9] |
[
|
| [10] |
[
|
| [11] |
|
| [12] |
[
|
| [13] |
[
|
| [14] |
|
| [15] |
[
|
| [16] |
[
|
| [17] |
|
| [18] |
|
| [19] |
|
| [20] |
[
|
| [21] |
|
| [22] |
[
|
| [23] |
|
| [24] |
[
|
| [25] |
[
|
/
| 〈 |
|
〉 |