
经济全球化能够有效抑制“一带一路”沿线国家的生态足迹吗?——来自动态门槛面板模型的经验证据
作者简介:聂莹(1986- ),女,河南濮阳人,博士,主要从事资源环境经济学与区域经济发展研究。E-mail: nieying0508@163.com
收稿日期: 2018-07-12
要求修回日期: 2018-11-26
网络出版日期: 2019-02-28
基金资助
北京师范大学学科交叉建设项目(B10.1);国家社会科学基金重大项目(14ZDA035);北京市自然科学基金项目(9172009);北京市科技计划项目(Z161100001116071)
Does economic globalization effectively inhibit the ecological footprint of countries along "The Belt and Road"?:Empirical evidence from the dynamic threshold panel model
Received date: 2018-07-12
Request revised date: 2018-11-26
Online published: 2019-02-28
Copyright
基于1993-2013年“一带一路”沿线55个国家的平行面板数据,运用Hansen动态面板门槛模型,以经济发展水平(人均GDP)为门槛变量,检验经济全球化与生态足迹之间的关系。研究结果表明:在不同的经济门槛范围内,经济全球化对生态足迹存在不同的影响。当经济发展水平小于等于3905美元时,经济全球化水平的提高能够显著降低生态足迹;当经济发展水平超过第一门槛值3905美元时,经济全球化水平对生态足迹的影响从显著抑制转变为促进作用,但是不显著;而当经济发展水平跨越第二门槛值8778美元时,经济全球化水平的提高能够显著刺激生态足迹的提高。当前“一带一路”沿线国家主要集中在第一门槛区间和第三门槛区间,经济全球化对生态足迹的影响出现两极分化态势,其中在第三门槛区间的国家在参与全球化的过程中应对资源的可持续利用引起充分重视,这关系到全球化的可持续发展和“一带一路”建设的顺利推进。
关键词: “一带一路”沿线国家;; 生态足迹; 经济全球化; 动态门槛面板模型
聂莹 , 刘清杰 , 孙素芬 . 经济全球化能够有效抑制“一带一路”沿线国家的生态足迹吗?——来自动态门槛面板模型的经验证据[J]. 自然资源学报, 2019 , 34(2) : 301 -311 . DOI: 10.31497/zrzyxb.20190207
Using the panel threshold model proposed by Hansen, this paper empirically studies the nonlinear relationship between economic globalization and ecological footprint based on panel data of 55 countries along "The Belt and Road" from 1993 to 2013, with economic development level (per capita GDP) as the threshold variable. The results show that there are distinctive relations between economic globalization and ecological footprint divided by thresholds rather than a single linear relationship. In different ranges of thresholds, the influences of economic globalization on ecological footprint are different. When the economic development level is less than per capita ${$}$ 3905, the improvement of economic globalization can effectively reduce the ecological footprint; when the economic development level exceeds the first threshold of per capita ${$}$ 3905, its improvement has positive effect on the ecological footprint, but the coefficient is not significant; when it exceeds the second threshold of per capita ${$}$ 8778, its improvement will increase the ecological footprint significantly. Currently, countries along "The Belt and Road" are mainly concentrated in the first and third threshold interval, and the influence of economic globalization on the ecological footprint has a polarization trend. Attention should be given to the countries in the third threshold interval in the process of globalization, which is closely related to many aspects in sustainable development of globalization and "The Belt and Road Initiative".
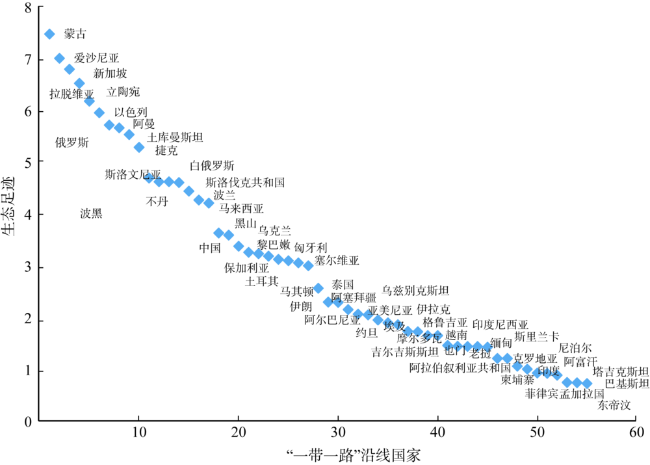
Fig. 1 Distribution map of the national ecological footprint along the Belt and Road in 2013图1 2013年“一带一路”沿线国家生态足迹值分布 |
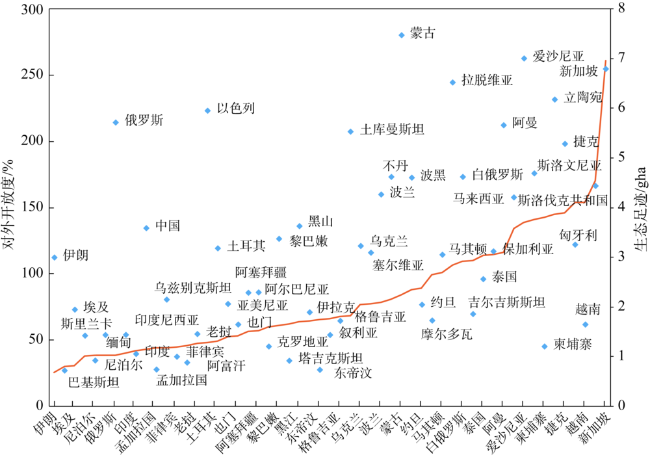
Fig. 2 The correlation between the national ecological footprint value and the opening degree of the country along the Belt and Road in 2013图2 2013年“一带一路”沿线国家生态足迹值与对外开放度相关性 |
Table 1 Descriptive statistical results.表1 描述性统计结果 |
| 均值 | 标准差 | 最小值 | 最大值 | |
|---|---|---|---|---|
| 生态足迹 | 2.8 | 1.8 | 0.4 | 9.3 |
| 经济全球化水平(%) | 75.8 | 43.7 | 15.6 | 345.4 |
| 人均GDP(ln) | 7.6 | 1.3 | 4.7 | 10.9 |
| 经济规模(ln) | 23.9 | 1.9 | 19.3 | 29.9 |
| 城镇化水平(%) | 51.2 | 20.3 | 10.0 | 100.0 |
Table 2 Threshold value estimation and test results表2 门槛值估计与检验结果 |
| 模型 | F值 | P值 | 自举次数 | 临界值 | ||
|---|---|---|---|---|---|---|
| 1% | 5% | 10% | ||||
| 单一门槛检验 | 51.507*** | 0.000 | 400 | 37.027 | 22.459 | 16.039 |
| 双重门槛检验 | 34.717*** | 0.005 | 400 | 20.609 | 4.977 | -0.628 |
| 三重门槛检验 | 17.622* | 0.070 | 400 | 34.273 | 20.444 | 13.512 |
注:本表结果为自举400次的结果,***、*分别表示在1%、10%以下的水平显著。 |
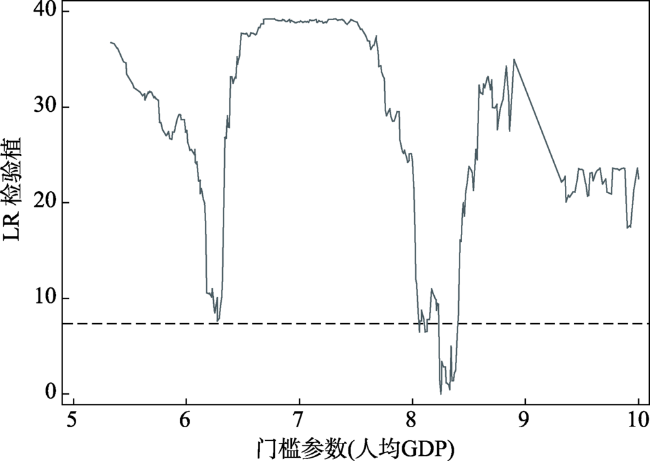
Fig. 3 The estimated value and confidence interval of the first threshold图3 第一个门槛的估计值和置信区间 |
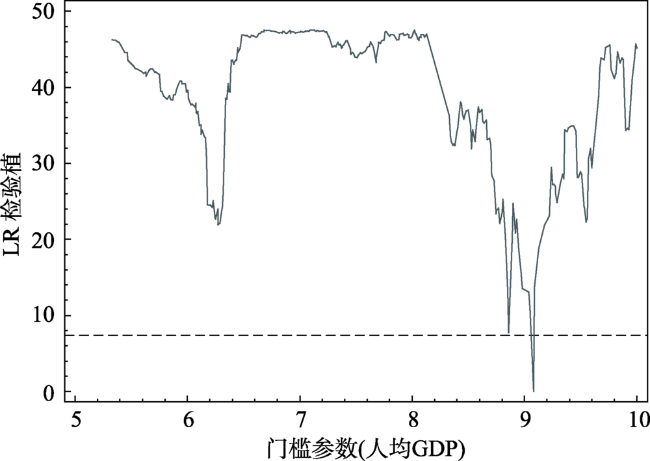
Fig. 4 The estimated values and confidence interval of the second threshold图4 第二个门槛的估计值和置信区间 |
Table 3 Threshold value and confidence interval表3 门槛估计值和置信区间 |
| 门槛估计值 | 95%置信区间 | |
|---|---|---|
| 门槛值 | 8.27 | [6.22, 8.39] |
| 门槛值 | 9.08 | [6.25, 9.08] |
Table 4 Results of threshold effect model estimation.表4 门槛效应模型估计结果 |
| 被解释变量 | 弹性系数 | T值 | P值 |
|---|---|---|---|
| 0.0034*** | 2.78 | 0.006 | |
| 0.2482*** | 9.53 | 0.000 | |
| 0.0057 | 1.08 | 0.279 | |
| -0.0027** | -2.14 | 0.033 | |
| 0.0003 | 0.22 | 0.825 | |
| 0.0037*** | 2.76 | 0.006 | |
| 常数项 | -3.642*** | -7.02 | 0.000 |
注:*、**、***分别表示在10%、5%、1%以下水平显著。 |
Table 5 Classification of countries falling into different threshold areas in 2015表5 2015年落入不同门槛区间的国家分类 |
| 区间 | 第一门槛区间 | 第二门槛区间 | 第三门槛区间 |
|---|---|---|---|
| 国家 | 阿富汗、亚美尼亚、孟加拉、不丹、埃及、格鲁吉亚、印度尼西亚、印度、吉尔吉斯斯坦、柬埔寨、老挝、斯里兰卡、摩尔多瓦、缅甸、尼泊尔、巴基斯坦、菲律宾、叙利亚、塔吉克斯坦、东帝汶、乌克兰、乌兹别克斯坦、越南、也门 | 阿尔巴尼亚、阿塞拜疆、保加利亚、波黑、白俄罗斯、中国、伊朗、伊拉克、约旦、黎巴嫩、马尔代夫、马其顿、黑山、蒙古、塞尔维亚、泰国、土库曼斯坦 | 阿联酋、巴林、文莱、捷克、爱沙尼亚、克罗地亚、匈牙利、以色列、哈萨克斯坦、科威特、立陶宛、拉脱维亚、马来西亚、阿曼、波兰、卡塔尔、罗马尼亚、俄罗斯、沙特阿拉伯、新加坡、斯洛伐克、斯洛文尼亚、土耳其 |
The authors have declared that no competing interests exist.
| [1] |
[
|
| [2] |
|
| [3] |
|
| [4] |
[
|
| [5] |
|
| [6] |
[
|
| [7] |
|
| [8] |
|
| [9] |
[
|
| [10] |
[
|
| [11] |
国务院发展研究中心课题组. 进出口贸易与我国经济增长. 经济日报, 2004-07-20.
[The State Council Development Research Center Team. Import and export trade and economic growth in China. The Economic Journal, 2004-07-20.]
|
| [12] |
WACKERNAGEL, MATHIS.Our Ecological Footprint: Reducing Human Impact on the Earth. New York: New Society Publishers, 1996.
|
| [13] |
[
|
| [14] |
[
|
| [15] |
|
| [16] |
|
/
| 〈 |
|
〉 |