
1990-2015年朝鲜土地覆被变化及驱动力分析
作者简介:董禹麟(1993- ),男,河北承德人,硕士,研究方向为生态遥感。E-mail: woorin5789@126.com
收稿日期: 2018-07-16
要求修回日期: 2018-12-03
网络出版日期: 2019-02-28
基金资助
中国科学院重点部署项目课题(KZZD-EW-08-02);国家自然科学基金项目(41461036)
Land cover change of DPRK and its driving forces from 1990 to 2015
Received date: 2018-07-16
Request revised date: 2018-12-03
Online published: 2019-02-28
Copyright
基于Landsat TM/OLI遥感数据,采用面向对象的图像分析方法,提取1990年和2015年朝鲜土地覆被信息,定量描绘土地覆被变化。结果表明:25年间朝鲜土地覆被共变化1.1×104 km2,林地和湿地分别减少4976.1 km2、203.3 km2,耕地和人工表面分别增加4821.5 km2、80 km2;耕地面积增加明显,94.6%的耕地来源于林地,两者的主要转化区在海拔为100~1000 m、坡度为 8°~35°的坡地;黄海北道的土地覆被变化最显著,其次是平安南道,两江道最不明显。人口增长、经济环境退化和宏观政策的调控等人为因素是推动朝鲜土地覆被变化的主要原因。本文弥补了朝鲜长时间尺度土地覆被变化研究的空白,同时为东北亚地区土地资源可持续利用和生态环境保护奠定了基础。
关键词: 土地覆被变化; 驱动力; 遥感; 面向对象的图像分析方法; 朝鲜
董禹麟 , 于皓 , 王宗明 , 李明玉 . 1990-2015年朝鲜土地覆被变化及驱动力分析[J]. 自然资源学报, 2019 , 34(2) : 288 -300 . DOI: 10.31497/zrzyxb.20190206
Land cover change (LCC) is an important part of global change study and sustainable development research. Accurately describing the process of land surface change at the national scale is a necessary step in the study of the relationship between man and nature. The analysis of land cover change of Democratic People's Republic of Korea (DPRK), a hot developing country of concern to the international community, will be a key point to lay a foundation for the sustainable utilization of land resources and ecological environment protection in Northeast Asia and cross-boundary region of China. In this study, Landsat TM/OLI images of DPRK in 1990 and 2015 were used to extract the information of land cover by using object-based images analysis (OBIA) and some statistical data were used to analyze the driving forces of land use change in DPRK. The results showed that forestland (-4976.1 km2) and cropland (+4821.5 km2) were the most obviously changed land cover of DPRK in the 25 years. Wetland decreased by 212.2 km2, while built-up land increased by 82.8 km2. Among various land cover changes of DPRK, the expansion of cropland converted mainly from montane forest (94.6%) were essential and fast. The conversion between forestland and cropland significantly occured in sloping fields with relatively high elevations (100-1000 m) and intermediate slope gradients (8°-35°). In the meantime, the changed area of wetland and built-up land were mainly found at lower elevation (0-100 m and 0-200 m) areas which were nearly flat (0-8°). North Hwanghae, with a change rate of 17.3%, was the most obviously changed district, followed by South Pyongan. Land cover change of Ryanggang was least apparent with a change rate of 2.2%. DPRK has been suffering from the economic downturn and worsening natural environment since the 1990s, and its land cover changes were influenced mostly by human factors such as the growth of population, the deterioration of economic environment and the regulation of national macro-policy.
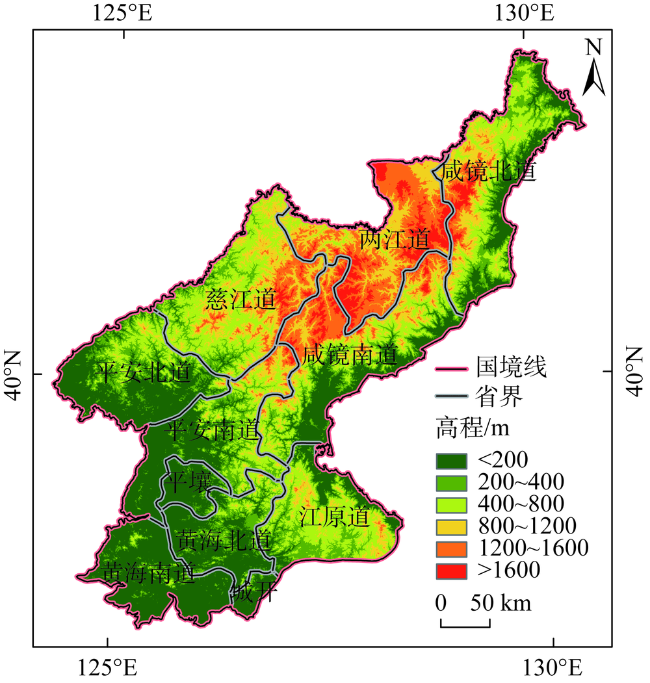
Fig. 1 Location and elevation of DPRK图1 朝鲜地理位置与高程 |
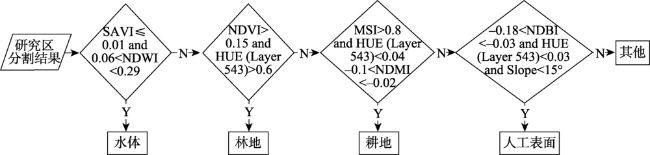
Fig. 2 Process of decision tree classification图2 决策树分类流程 |
Table 1 Classification accuracy of land cover for DPRK in 1990 and 2015 (%)表1 各土地覆被类型分类精度 |
| 分类结果 | 林地 | 耕地 | 水体 | 人工表面 | 草地 | 裸土地 | 湿地 | 火烧迹地 | |
|---|---|---|---|---|---|---|---|---|---|
| 1990年 | 制图精度 | 95.0 | 97.2 | 94.5 | 96.4 | 83.3 | 75.0 | 89.5 | 94.1 |
| 用户精度 | 97.4 | 96.3 | 89.5 | 94.6 | 83.3 | 81.8 | 94.4 | 88.9 | |
| 2015年 | 制图精度 | 95.3 | 96.5 | 90.0 | 97.6 | 75.0 | 77.8 | 86.7 | 92.9 |
| 用户精度 | 97.3 | 93.3 | 92.3 | 93.2 | 81.8 | 87.5 | 86.7 | 92.9 | |
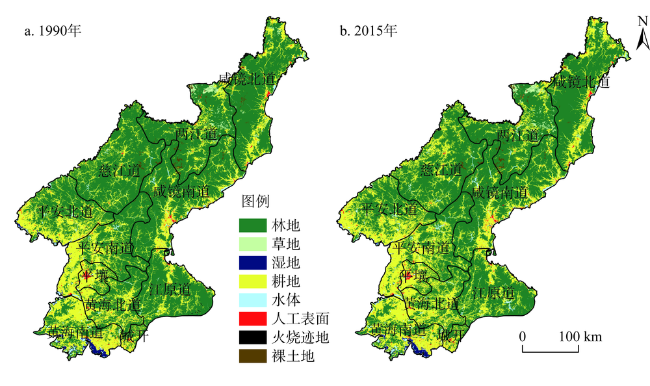
Fig. 3 Land cover of DPRK in 1990 and 2015图3 1990年与2015年朝鲜土地覆被情况 |
Table 2 Areal extent change of land cover in DPRK from 1990 to 2015表2 1990-2015年朝鲜各土地覆被类型变化面积及比率 |
| 土地覆被类型 | 林地 | 耕地 | 水体 | 人工表面 | 草地 | 裸土地 | 湿地 | 火烧迹地 |
|---|---|---|---|---|---|---|---|---|
| 变化面积/km2 | -4976.1 | +4821.5 | +387.5 | +80.0 | +15.6 | -79.2 | -203.3 | -46.0 |
| 变化率/% | -6.1 | +15.0 | +11.6 | +9.7 | +1.8 | -12.8 | -27.5 | -59.9 |
注:不包括周边海岛,“+”为增加,“-”为减少,下同。 |
Table 3 Areal extent change of land cover in various administrative disticts of DPRK from 1990 to 2015 (km2)表3 1990-2015年朝鲜各行政区土地覆被类型面积变化 |
| 行政区 | 林地 | 耕地 | 水体 | 人工表面 | 草地 | 裸土地 | 湿地 | 火烧迹地 |
|---|---|---|---|---|---|---|---|---|
| 慈江道 | -1190.1 | +1154.1 | +41.3 | +6.4 | -4.0 | -6.0 | -0.4 | +0.7 |
| 黄海北道 | -673.5 | +652.9 | +13.1 | +6.8 | +0.1 | +0.0 | -0.4 | |
| 黄海南道 | -90.0 | +124.4 | +4.5 | +7.0 | -1.0 | +0.3 | -43.4 | -1.5 |
| 江原道 | -616.7 | +496.8 | +85.3 | +1.3 | +31.7 | +0.7 | +0.5 | +0.5 |
| 开城工业区 | -15.7 | +7.4 | +1.7 | +5.4 | +1.5 | -0.3 | ||
| 两江道 | -106.6 | +45.0 | +58.6 | +9.9 | +37.8 | -18.7 | -2.1 | -23.8 |
| 平安北道 | -452.4 | +464.9 | +71.9 | +3.8 | +10.3 | -99.3 | -0.1 | |
| 平安南道 | -874.1 | +870.8 | +49.4 | +14.8 | +1.2 | -2.0 | -59.6 | +0.0 |
| 平壤特别市 | -117.4 | +112.2 | +3.4 | +10.7 | -1.8 | -7.1 | ||
| 咸镜北道 | -354.0 | +447.8 | +4.8 | +1.6 | -42.7 | -56.5 | -1.3 | |
| 咸镜南道 | -485.6 | +445.3 | +53.6 | +12.4 | -7.4 | -7.1 | +1.4 | -13.1 |
Table 4 Conversion matrix of land cover of DPRK from 1990 to 2005表4 1990-2015年朝鲜土地覆被类型转化表 |
| 1990-2015年各类型间转化 | 林地 | 耕地 | 水体 | 人工表面 | 草地 | 裸土地 | 湿地 | 火烧迹地 | |
|---|---|---|---|---|---|---|---|---|---|
| 林地 | 面积/km2 | 5430.3 | 80.2 | 11.1 | 88.7 | 12.7 | 0.9 | 22.8 | |
| 比例/% | 96.2 | 1.4 | 0.2 | 1.6 | 0.2 | 0 | 0.4 | ||
| 耕地 | 面积/km2 | 440.7 | 344.1 | 78.7 | 20.2 | 17.0 | 14.1 | 0 | |
| 比例/% | 48.2 | 37.6 | 8.6 | 2.2 | 1.9 | 1.5 | 0 | ||
| 水体 | 面积/km2 | 12.4 | 146.5 | 0.9 | 0.1 | 4.3 | 61.8 | 0 | |
| 比例/% | 5.5 | 64.9 | 0.4 | 0 | 1.9 | 27.4 | 0 | ||
| 人工表面 | 面积/km2 | 0.6 | 8.9 | 0.1 | 0 | 2.6 | 0 | 0 | |
| 比例/% | 5.2 | 72.6 | 1.0 | — | 21.3 | — | — | ||
| 草地 | 面积/km2 | 67.5 | 24.6 | 1.2 | 0.1 | 4.0 | 0 | 0 | |
| 比例/% | 69.4 | 25.3 | 1.2 | 0.1 | 4.1 | — | — | ||
| 裸土地 | 面积/km2 | 94.5 | 15.1 | 8.1 | 0.4 | 0.8 | 0 | 0 | |
| 比例/% | 79.5 | 12.7 | 6.9 | 0.3 | 0.6 | — | — | ||
| 湿地 | 面积/km2 | 5.7 | 101.5 | 171.8 | 1.0 | 0 | 0.6 | 0 | |
| 比例/% | 2.0 | 36.2 | 61.2 | 0.4 | — | 0.2 | — | ||
| 火烧迹地 | 面积/km2 | 49.1 | 9.1 | 7.6 | 0.1 | 3.0 | 0.2 | 0 | |
| 比例/% | 71.2 | 13.1 | 11.0 | 0.1 | 4.3 | 0.3 | 0 | ||
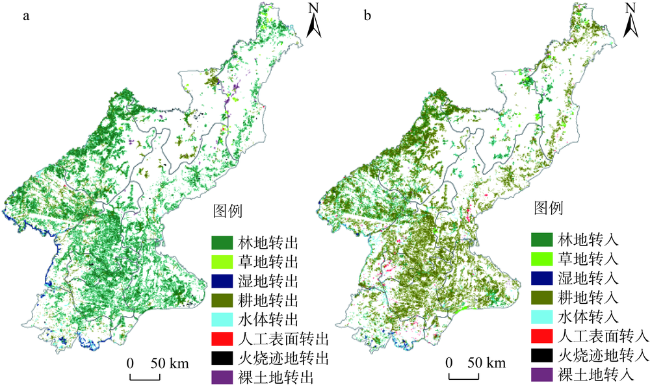
Fig. 4 Land cover conversion of DPRK in 1990 and 2015图4 1990年和2015年朝鲜土地覆被转化空间位置 |
Table 5 Results of spatial analysis between land cover change and terrain factor (km2)表5 土地覆被变化与地形因子的空间分析结果 |
| 土地覆被类型 | 林地 | 耕地 | 水体 | 人工表面 | 草地 | 裸土地 | 湿地 | 火烧迹地 | |
|---|---|---|---|---|---|---|---|---|---|
| 高程/m | 0~100 | -581.4 | +579.8 | +142.8 | +54.5 | +2.3 | +3.0 | -200.8 | -1.1 |
| 100~300 | -1581.2 | +1449.2 | +100.8 | +10.8 | +25.8 | +4.2 | -0.45 | -8.8 | |
| 300~500 | -1506.7 | +1463.8 | +42.2 | +3.9 | -4.9 | -1.3 | +0.1 | +3.3 | |
| 500~1000 | -1443.8 | +1410.8 | +56.7 | +7.5 | -6.5 | -2.4 | -1.2 | -21.0 | |
| 1000~2 000 | +82.7 | -82.2 | +44.9 | +3.4 | +6.9 | -36.2 | -1.0 | -18.5 | |
| 2000~2727 | +54.3 | +0.1 | -8.0 | -46.4 | |||||
| 坡度/° | 0~5 | -323.0 | +233.4 | +218.9 | +52.2 | +15.9 | -12.9 | -173.5 | -10.9 |
| 5~8 | -500.4 | +459.0 | +65.7 | +13.6 | -3.3 | -9.5 | -19.3 | -5.7 | |
| 8~15 | -1561.7 | +525.0 | +62.3 | +9.7 | +1.1 | -17.9 | -8.8 | -9.7 | |
| 15~25 | -1830.2 | +1832.4 | +28.9 | +3.8 | +1.9 | -21.5 | -1.4 | -14.0 | |
| 25~35 | -661.1 | +669.4 | +8.9 | +0.6 | +0.5 | -12.9 | -0.3 | -5.2 | |
| 35~87 | -99.8 | +102.5 | +2.8 | +0.2 | -0.4 | -4.5 | -0.1 | -0.6 | |
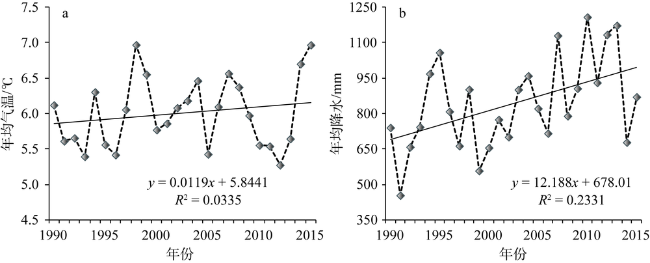
Fig. 5 Variation of temperature and precipitation in DPRK from 1990 to 2015图5 1990-2015年朝鲜气温及降水趋势 |
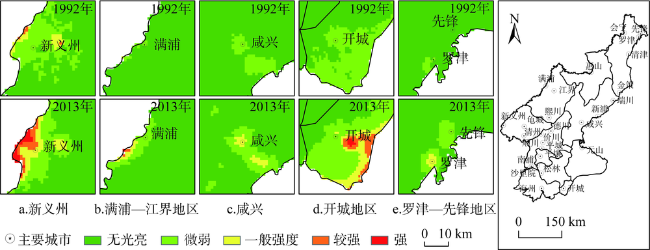
Fig. 6 Obvious night-time DN growth regions of DPRK in 1992 and 2013图6 1992年和2013年朝鲜灯光指数主要增长地区 |
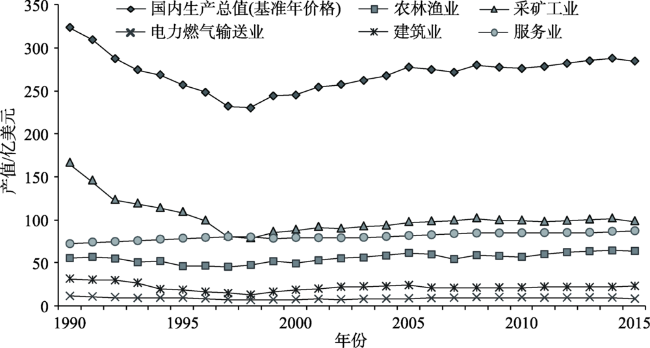
Fig. 7 Variation of real GDP and industrial output value图7 国内生产总值与主要产业产值变化 |
The authors have declared that no competing interests exist.
| [1] |
|
| [2] |
[
|
| [3] |
|
| [4] |
[
|
| [5] |
|
| [6] |
|
| [7] |
|
| [8] |
|
| [9] |
|
| [10] |
|
| [11] |
|
| [12] |
|
| [13] |
[
|
| [14] |
[
|
| [15] |
|
| [16] |
[
|
| [17] |
[
|
| [18] |
[
|
| [19] |
|
| [20] |
[
|
| [21] |
[
|
| [22] |
|
| [23] |
|
| [24] |
[
|
| [25] |
[
|
| [26] |
[
|
| [27] |
[
|
| [28] |
|
| [29] |
|
| [30] |
|
| [31] |
[
|
| [32] |
|
| [33] |
|
| [34] |
[
|
| [35] |
|
| [36] |
[
|
| [37] |
[
|
| [38] |
[
|
| [39] |
[
|
| [40] |
[
|
| [41] |
[
|
/
| 〈 |
|
〉 |