
耦合MOP与GeoSOS-FLUS模型的县级土地利用结构与布局复合优化
作者简介:曹帅(1996- ),男,黑龙江鹤岗人,硕士,主要从事土地资源管理研究。E-mail: caoshuai_nju@126.com
收稿日期: 2018-11-12
要求修回日期: 2019-04-09
网络出版日期: 2019-06-20
基金资助
国家科技支撑计划项目(2015BAD06B02)
Coupled MOP and GeoSOS-FLUS models research on optimization of land use structure and layout in Jintan district
Received date: 2018-11-12
Request revised date: 2019-04-09
Online published: 2019-06-20
Copyright
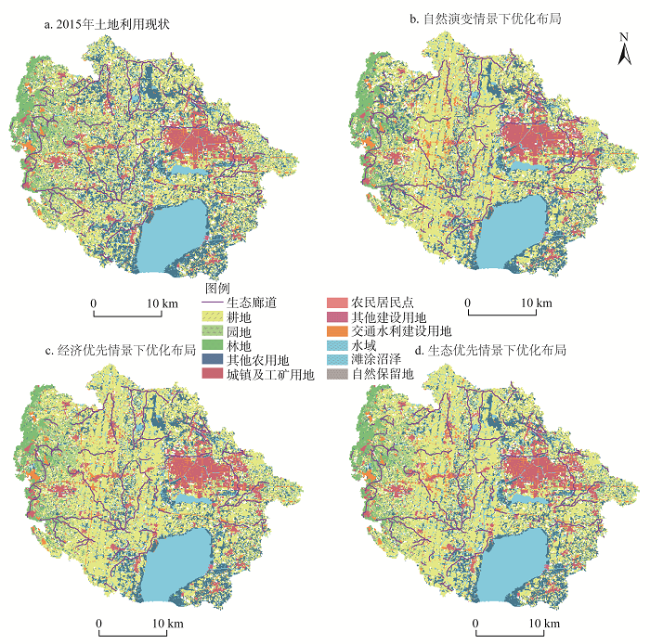
在自然资源整合不断加强,土地利用结构日趋复杂的形势下,采用单一土地利用结构优化方式难以有效满足区域土地利用合理规划的需求。综合考虑生态文明、乡村振兴、城乡融合等土地可持续利用目标,构建土地利用结构优化与布局优化的集成体系,对提升规划适用性具有积极作用。选取常州市金坛区为研究区,以经济效益与生态效益为优化目标,设置自然演变、经济优先和生态优先三种发展情景,在通过MOP(多目标规划)模型进行土地利用结构优化的基础上,利用GeoSOS-FLUS模型实现土地利用布局优化。结果表明:通过集成MOP和GeoSOS-FLUS模型,采用”结构+约束+布局+准则“研究模式探索县域单元下的土地利用结构布局优化,对调整土地利用结构,优化土地利用空间布局有一定帮助。从案例分析结果看,城镇工矿用地数量在自然演变和经济效益优先情景下分别增加了39%和95%;林地在生态效益优先情景下增加了40%;农村居民点在三种情景下分别减少33%、66%和66%。在三种发展情景下,空间格局都将面临城镇空间与生态空间两级分化的现象,后期区域发展中应加强城乡土地利用与生态保护协调发展,促进空间布局均衡化。
曹帅 , 金晓斌 , 杨绪红 , 孙瑞 , 刘晶 , 韩博 , 徐伟义 , 周寅康 . 耦合MOP与GeoSOS-FLUS模型的县级土地利用结构与布局复合优化[J]. 自然资源学报, 2019 , 34(6) : 1171 -1185 . DOI: 10.31497/zrzyxb.20190604
Faced with the background of natural resources integration and the more complex land use structure, it is difficult to effectively meet the demand for rational land use planning with a single land use structure optimization method. Considering the objectives of sustainable utilization of land use, ecological civilization, rural development, and urban-rural integration, we constructed an integrated system for land use structure and layout optimization, which will play a positive role in improving the applicability of planning. This study first sets three scenarios of natural evolution, economic priority, and ecological priority, and then uses the MOP model (multi-objective planning model) to calculate the optimal land use structure under different scenarios. Finally, it can carry on land use layout optimization based on the GeoSOS-FLUS model in 2030, Jintan district, Jiangsu province, China. Results show that, by integrating the MOP and GeoSOS-FLUS models and adopting the "Structure + Constraint + Layout + Criterion" approach to optimize the land use structure and layout in the county, it is conducive to optimize the quantitative land use structure and improve the land use spatial distribution; from the results of the case analysis, the area of industrial and mining land in cities and towns has increased by 39% and 95% under the natural evolution and economic efficiency priority scenarios; the forest land has increased by 40% under the eco-efficiency priority scenario; rural settlements decreased by 33%, 66% and 66%, respectively in the three scenarios. Under the three development scenarios, the spatial pattern will face the two-level differentiation of urban space and ecological space. In the later period of regional development, it is necessary to strengthen the coordinated development of urban and rural land use and ecological protection, and promote a balanced spatial distribution.
Key words: land use structure; land use layout; MOP model; GeoSOS-FLUS model; optimization; Jintan
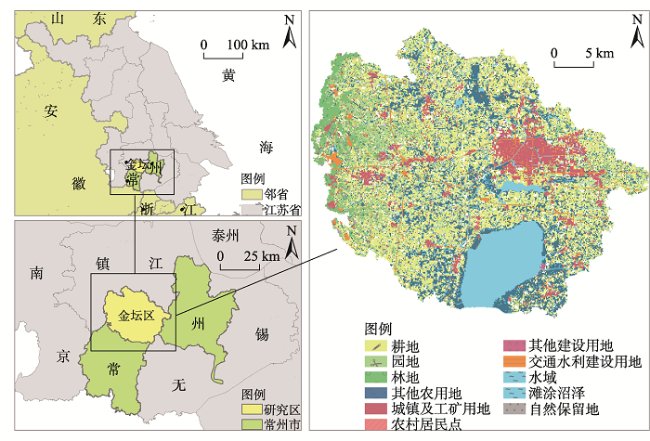
Fig. 1 The location of the study area and its land use status图1 研究区区位示意与土地利用现状 |
Table 1 Economic, social and land use changes in 2006 and 2017表1 2006年与2017年经济社会与土地利用变化情况 |
| 年份 | 经济社会 | 土地利用/km2 | |||||||
|---|---|---|---|---|---|---|---|---|---|
| 城市化率/% | GDP/亿元 | 人均GDP/(万元/人) | 建设用地 | 耕地 | 林地 | 水域 | |||
| 城镇工矿用地 | 农村居民点 | ||||||||
| 2006 | 32.72 | 182.01 | 3.34 | 62.60 | 67.00 | 390.94 | 39.63 | 131.38 | |
| 2017 | 62.06 | 708.34 | 12.65 | 70.64 | 68.54 | 337.46 | 39.12 | 130.62 | |
Table 2 Data description表2 数据说明 |
| 数据类型 | 数据来源 | 数据说明 | 数据用途 |
|---|---|---|---|
| 土地利用数据 | 2015金坛区土地变更调查成果数据库 | 比例尺1∶1万 | 模型基础输入数据 |
| 统计数据 | 《金坛年鉴》 | 2007-2017年 | 相关统计数据获取 |
| 《常州统计年鉴》 | 2007-2017年 | 相关统计数据获取 | |
| 农用地分等数据 | 2015年金坛区农用地分等定级成果更新数据库 | 比例尺1∶1万 | 耕地质量驱动力因子 |
| 规划数据 | 《金坛城市总体规划2013-2030》 | 文本及图件 | 约束条件确定 |
| 《金坛市土地利用总体规划2006-2020》 | 文本及图件 | 约束条件确定 | |
| 《江苏省生态红线区域保护规划》 | 文本及图件 | 限制转化区域确定 | |
| DEM | ASTER GDEM V2版 | 100 m100 m | 自然地形驱动力因子 |
| 夜间灯光数据 | Version 4 DMSP-OLS Nighttime Lights Time Series, http://www.noaa.gov/ | 1 km1 km | 景观阻力面修正社会经济驱动力因子 |
| 常州市交通图 | 百度地图,http://map.baidu.com/ | 比例尺1∶1万 | 交通区位驱动力因子 |
| 月均降水量/mm | 国家气象科学数据共享服务平台 | 4 km4 km | 自然地形驱动力因子 |
Table 3 Economic and ecological efficiency coefficient per unit area in Jintan district (万元/hm2·年) |
| 效益系数 | 耕地 | 园地 | 林地 | 其他农用地 | 城镇工 矿用地 | 农村 居民点 | 其他建设 用地 | 交通水利 建设用地 | 水域 | 滩涂 沼泽 | 自然 保留地 |
|---|---|---|---|---|---|---|---|---|---|---|---|
| 经济系数 | 6.3 | 30.5 | 1.7 | 10.4 | 2738.3 | 18.9 | 4125.6 | 2738.3 | 25.34 | 0 | 0 |
| 生态系数 | 0.61 | 1.27 | 1.93 | 1.1 | -2.11 | -2.11 | 1.2 | -2.51 | 4.07 | 5.55 | 0.04 |
2.2 约束条件
Table 4 The optimization conditions of land use structure optimization in Jintan district表4 金坛区土地利用结构优化约束条件 |
| 约束名称 | 约束因素 | 约束表达式 | 约束条件解释 |
|---|---|---|---|
| 总量约束 | 土地面积 | 土地总面积不变 | |
| 规划目标约束 | 耕地面积 | 约束性指标 | |
| 园地面积 | | 约束性指标 | |
| 林地面积 | 约束性指标 | ||
| 其他农用地面积 | 约束性指标 | ||
| 城镇工矿用地面积 | 约束性指标 | ||
| 农村居民点面积 | 约束性指标 | ||
| 其他建设用地面积 | 恒定指标 | ||
| 交通水利建设用地面积 | 约束性指标 | ||
| 水域面积 | | 约束性指标 | |
| 滩涂沼泽 | 恒定指标 | ||
| 自然保留地 | 约束性指标 | ||
| 土地可持续利用约束 | 土地可持续利用综合指数 | 弹性指标 | |
| 城乡用地比例约束[1] | 城乡用地比例 | 弹性指标 | |
| 配套协调约束[1] | 交通水利建设用地面积 | 发展规律数据 | |
| 开发强度约束[2] | 土地开发强度 | 环境最宜居 |
注:1. 城乡用地比例约束范围和配套协调约束系数参考《江苏省土地利用总体规划2006-2020》中城乡用地面积比例和交通水利建设用地占城镇工矿用地面积比例,根据历史变化趋势,结合城乡融合发展理念确定;2. 开发强度约束系数参考国际宜居标准中的土地开发强度比例。 |
Table 5 Land use optimization structure and target in Jintan district under different scenarios表5 不同情景下金坛区土地利用优化结构及目标 |
| 变量符号 | 变量名称 | 2020规划值 | 情景1(自然演变) | 情景2(经济优先) | 情景3(生态优先) |
|---|---|---|---|---|---|
| 耕地/hm2 | 42810.00 | 42810.00 | 42810.00 | 42810.00 | |
| 园地/hm2 | 4676.41 | 3818.39 | 2110.08 | 5110.09 | |
| 林地/hm2 | 9255.30 | 8604.51 | 8114.34 | 12925.65 | |
| 其他农用地/hm2 | 10989.02 | 10989.02 | 10409.02 | 10989.02 | |
| 城镇工矿用地/hm2 | 5219.16 | 7235.64 | 10175.31 | 5219.16 | |
| 农村居民点/hm2 | 6110.08 | 4076.80 | 2073.46 | 2073.46 | |
| 其他建设用地/hm2 | 163.72 | 163.72 | 163.72 | 163.72 | |
| 交通水利建设用地/hm2 | 4122.94 | 5716.15 | 8038.50 | 4123.14 | |
| 水域/hm2 | 13680.27 | 13680.27 | 13200.07 | 13680.27 | |
| 滩涂沼泽/hm2 | 225.35 | 157.75 | 157.75 | 157.75 | |
| 自然保留地/hm2 | 340.01 | 340.01 | 340.01 | 340.01 | |
| 土地总面积/hm2 | 97592.26 | 97592.26 | 97592.26 | 97592.26 | |
| 经济效益/万元 | 2.73107 | 3.71107 | 5.14107 | 2.72107 | |
| 生态效益 | 8.49104 | 7.82104 | 6.47104 | 10.07104 |
Fig. 2 Land use optimization layout in Jintan District under different scenarios图2 金坛区不同情景下土地利用优化布局 |
The authors have declared that no competing interests exist.
| [1] |
[
|
| [2] |
[
|
| [3] |
[
|
| [4] |
[
|
| [5] |
[
|
| [6] |
[
|
| [7] |
[
|
| [8] |
|
| [9] |
|
| [10] |
|
| [11] |
[
|
| [12] |
[
|
| [13] |
|
| [14] |
|
| [15] |
|
| [16] |
|
| [17] |
[
|
| [18] |
[
|
| [19] |
[
|
| [20] |
|
| [21] |
[
|
| [22] |
[
|
| [23] |
[
|
| [24] |
|
| [25] |
[
|
| [26] |
[
|
| [27] |
|
| [28] |
[
|
| [29] |
|
| [30] |
[
|
| [31] |
[
|
/
| 〈 |
|
〉 |