 PDF(1364 KB)
 PDF(1364 KB)
PDF(1364 KB)
PDF(1364 KB)
南阳盆地区耕地利用效率演变及其影响因素
The evolution of cultivated land utilization efficiency and its influencing factors in Nanyang Basin
 ({{custom_author.role_en}}), {{javascript:window.custom_author_en_index++;}}
研究耕地利用效率演变规律关乎农业产业振兴与国家粮食安全。在使用DEA-GWR指数模型测算出南阳盆地区12县(区)2000年、2010年、2016年耕地利用效率的基础上,结合趋势面分析和
Studying the evolution law of cultivated land utilization efficiency is related to agricultural industry revitalization and national food security. This paper, which is based on the calculation of cultivated land utilization efficiency of 12 counties in Nanyang Basin over the 2000, 2010 and 2016 with the DEA-GWR model, investigates characteristics of spatiotemporal evolution of cultivated land utilization efficiency by using trend surface analysis and
耕地利用效率 / 时空演变 / DEA-GWR模型 / 影响因素 / 南阳盆地 {{custom_keyword}} /
cultivated land utilization efficiency / spatiotemporal evolution / DEA-GWR model / influencing factor / Nanyang Basin {{custom_keyword}} /
表1 耕地利用效率投入—产出指标体系Table 1 The input and output indicator system of cultivated land utilization efficiency |
表2 南阳盆地各县(区)耕地利用综合效率Table 2 The comprehensive utilization efficiency of cultivated land of each county in Nanyang Basin |
| DMU | 2000年 | 2010年 | 2016年 |
|---|---|---|---|
| 宛城区 | 0.958 | 0.734 | 0.571 |
| 卧龙区 | 0.746 | 0.697 | 0.868 |
| 南召县 | 1.000 | 0.995 | 0.912 |
| 方城县 | 0.680 | 0.741 | 0.778 |
| 西峡县 | 0.521 | 1.000 | 1.000 |
| 镇平县 | 0.979 | 1.000 | 0.952 |
| 内乡县 | 0.818 | 0.784 | 0.908 |
| 淅川县 | 0.657 | 0.664 | 0.855 |
| 社旗县 | 0.947 | 1.000 | 1.000 |
| 唐河县 | 1.000 | 1.000 | 1.000 |
| 新野县 | 0.496 | 0.644 | 0.594 |
| 桐柏县 | 1.000 | 0.642 | 0.692 |
| 均值 | 0.817 | 0.825 | 0.844 |
表3 南阳盆地各县(区)耕地利用纯技术效率Table 3 The pure technical efficiency of cultivated land utilization of each county in Nanyang Basin |
| DMU | 2000年 | 2010年 | 2016年 |
|---|---|---|---|
| 宛城区 | 0.992 | 0.900 | 0.624 |
| 卧龙区 | 0.749 | 0.840 | 0.880 |
| 南召县 | 1.000 | 1.000 | 1.000 |
| 方城县 | 0.699 | 0.747 | 0.784 |
| 西峡县 | 0.957 | 1.000 | 1.000 |
| 镇平县 | 1.000 | 1.000 | 1.000 |
| 内乡县 | 0.821 | 1.000 | 1.000 |
| 淅川县 | 0.659 | 0.832 | 0.865 |
| 社旗县 | 0.966 | 1.000 | 1.000 |
| 唐河县 | 1.000 | 1.000 | 1.000 |
| 新野县 | 0.560 | 0.632 | 0.632 |
| 桐柏县 | 1.000 | 0.909 | 0.909 |
| 均值 | 0.867 | 0.924 | 0.891 |
表4 南阳盆地各县(区)耕地利用规模效率Table 4 The scale efficiency of cultivated land utilization of each county in Nanyang Basin |
| DMU | 2000年 | 2010年 | 2016年 |
|---|---|---|---|
| 宛城区 | 0.965 | 0.815 | 0.915 |
| 卧龙区 | 0.996 | 0.829 | 0.986 |
| 南召县 | 1.000 | 0.995 | 0.912 |
| 方城县 | 0.973 | 0.993 | 0.993 |
| 西峡县 | 0.545 | 1.000 | 1.000 |
| 镇平县 | 0.979 | 1.000 | 0.952 |
| 内乡县 | 0.997 | 0.784 | 0.908 |
| 淅川县 | 0.997 | 0.798 | 0.988 |
| 社旗县 | 0.980 | 1.000 | 1.000 |
| 唐河县 | 1.000 | 1.000 | 1.000 |
| 新野县 | 0.886 | 0.839 | 0.941 |
| 桐柏县 | 1.000 | 0.642 | 0.761 |
| 均值 | 0.943 | 0.891 | 0.946 |
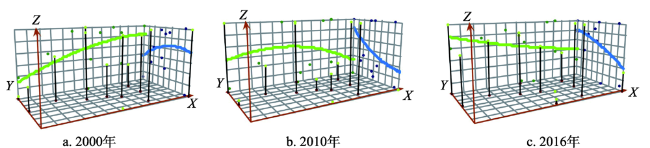
图1 南阳盆地耕地利用综合效率趋势面Fig. 1 Trend surface of comprehensive efficiency of cultivated land utilization in Nanyang Basin |
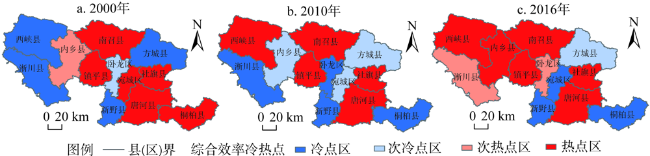
图2 南阳盆地耕地利用综合效率冷热点分布Fig. 2 Cold and hot spots distribution of comprehensive efficiency of cultivated land utilization in Nanyang Basin |
| 变量 | 2000年 | 2010年 | 2016年 |
|---|---|---|---|
| Cond | 24.049~24.263 | 14.18~14.20 | 18.45~18.86 |
| 农业劳动力 | (0.730~0.946) 0.822 | (0.491~0.582) 0.538 | (0.309~0.369) 0.326 |
| 化肥施用量 | (0.212~0.299) 0.255 | (-0.173~ -0.056) -0.149 | (-0.277~ -0.192) -0.235 |
| 农业机械总动力 | (0.246~0.459) 0.335 | (0.118~0.352) 0.236 | (-0.397~ -0.198) -0.274 |
| 农村居民人均可支配收入 | (0.014~0.219) 0.172 | (0.082~0.256) 0.120 | (0.072~0.095) 0.086 |
| 城市化水平 | (-0.155~ -0.036) -0.084 | (-0.527~ -0.209) -0.392 | (-0.438~ -0.006) -0.117 |
| 复种指数 | (0.142~0.518) 0.356 | (0.229~0.694) 0.372 | (0.197~0.628) 0.314 |
| 人均耕地 | (-0.077~0.401) 0.196 | (0.203~0.226) 0.219 | (0.217~0.331) 0.276 |
| 地形条件 | (0.055~0.310) 0.192 | (0.206~0.237) 0.214 | (0.194~0.228) 0.210 |
| Bandwidth | 21.515 | 22.275 | 22.275 |
| Residual Squares | 0.112 | 0.081 | 0.025 |
| Effective Number | 10.554 | 8.009 | 9.008 |
| Sigma | 0.278 | 0.142 | 0.092 |
| AICc | 68.967 | 82.364 | 201.031 |
| R2 | 0.723 | 0.707 | 0.903 |
| Adjusted R2 | 1.106 | 0.194 | 0.643 |
| [1] |
谢花林, 张道贝, 王伟, 等. 鄱阳湖生态经济区耕地利用效率时空差异及其影响因素分析. 水土保持研究, 2016,23(5):214-221.
[
{{custom_citation.content}}
{{custom_citation.annotation}}
|
| [2] |
匡丽花, 叶英聪, 赵小敏, 等. 基于改进TOPSIS方法的耕地系统安全评价及障碍因子诊断. 自然资源学报, 2018,33(9):1627-1641.
[
{{custom_citation.content}}
{{custom_citation.annotation}}
|
| [3] |
封永刚, 彭珏, 邓宗兵, 等. 面源污染、碳排放双重视角下中国耕地利用效率的时空分异. 中国人口·资源与环境, 2015,25(8):18-25.
[
{{custom_citation.content}}
{{custom_citation.annotation}}
|
| [4] |
王良健, 李辉. 中国耕地利用效率及其影响因素的区域差异: 基于281个市的面板数据与随机前沿生产函数方法. 地理研究, 2014,33(11):1995-2004.
[
{{custom_citation.content}}
{{custom_citation.annotation}}
|
| [5] |
张荣天, 焦华富. 中国省际耕地利用效率时空格局分异与机制分析. 农业工程学报, 2015,31(2):277-287.
[
{{custom_citation.content}}
{{custom_citation.annotation}}
|
| [6] |
单玉红, 朱枫, 柯新利. 湖北省耕地利用效率时空分异及农业劳动力的差别化调控. 应用科学学报, 2015,33(4):419-428.
[
{{custom_citation.content}}
{{custom_citation.annotation}}
|
| [7] |
匡兵, 卢新海, 韩璟, 等. 考虑碳排放的粮食主产区耕地利用效率区域差异与变化. 农业工程学报, 2018,34(11):1-8.
[
{{custom_citation.content}}
{{custom_citation.annotation}}
|
| [8] |
刘春腊, 王鹏, 徐美, 等. 湘西多民族山区耕地利用效率空间差异分析. 冰川冻土, 2013,35(5):1308-1318.
[
{{custom_citation.content}}
{{custom_citation.annotation}}
|
| [9] |
栾敬东, 焦丽娟, 朱乾隆. 耕地利用效率时空差异及影响因素研究: 基于乡村振兴战略. 山西农业大学学报: 社会科学版, 2018,17(6):45-53.
[
{{custom_citation.content}}
{{custom_citation.annotation}}
|
| [10] |
叶浩, 濮励杰. 我国耕地利用效率的区域差异及其收敛性研究. 自然资源学报, 2011,26(9):1467-1474.
[
{{custom_citation.content}}
{{custom_citation.annotation}}
|
| [11] |
王海力, 韩光中, 谢贤健. 基于DEA模型的西南地区耕地利用效率时空格局演变及影响因素分析. 长江流域资源与环境, 2018,27(12):2784-2795.
[
{{custom_citation.content}}
{{custom_citation.annotation}}
|
| [12] |
李俏, 谷国锋, 姚丽, 等. 黑龙江垦区耕地利用效率变化分析. 干旱区资源与环境, 2016,30(4):30-35.
[
{{custom_citation.content}}
{{custom_citation.annotation}}
|
| [13] |
何登, 杨如军, 詹长根. 基于DEA模型的耕地利用效率评价. 江苏农业科学, 2018,46(4):327-330.
[
{{custom_citation.content}}
{{custom_citation.annotation}}
|
| [14] |
陈晨, 伍国勇. 基于四阶段DEA的安徽省耕地利用效率分析. 水土保持通报, 2018,38(4):288-294.
[
{{custom_citation.content}}
{{custom_citation.annotation}}
|
| [15] |
郑福云, 郭文栋, 魏延军, 等. 基于SBM模型的黑龙江省耕地集约利用的碳排放效率研究. 国土资源情报, 2017, ( 12):9-14, 28.
[
{{custom_citation.content}}
{{custom_citation.annotation}}
|
| [16] |
{{custom_citation.content}}
{{custom_citation.annotation}}
|
| [17] |
刘玉海, 张丽. 耕地生产率与全要素耕地利用效率: 基于SBM-DEA方法的省际数据比较. 农业技术经济, 2012, ( 6):47-56.
[
{{custom_citation.content}}
{{custom_citation.annotation}}
|
| [18] |
张荣天, 陆建飞. 基于DEA-ESDA模型的江苏县域耕地利用效率时空格局分析. 江苏农业科学, 2019,47(3):269-272.
[
{{custom_citation.content}}
{{custom_citation.annotation}}
|
| [19] |
李在军, 管卫华, 臧磊. 山东省耕地生产效率及影响因素分析. 世界地理研究, 2013,22(2):167-175.
[
{{custom_citation.content}}
{{custom_citation.annotation}}
|
| [20] |
陈海喜, 钟九生, 兰安军, 等. 基于灰色关联模型的贵州省耕地利用效率及其影响因素研究. 贵州科学, 2018,36(6):61-68.
[
{{custom_citation.content}}
{{custom_citation.annotation}}
|
| [21] |
{{custom_citation.content}}
{{custom_citation.annotation}}
|
| [22] |
魏权龄. 数据包络分析. 北京:科学出版社, 2004.
[
{{custom_citation.content}}
{{custom_citation.annotation}}
|
| [23] |
徐丹丹, 曾章备, 董莹. 基于效率评价视角的国有企业分类改革实现路径研究: 以高端装备制造业为例. 中国软科学, 2017, ( 7):182-192.
[
{{custom_citation.content}}
{{custom_citation.annotation}}
|
| [24] |
刘浩, 何寿奎, 王娅. 基于三阶段DEA和超效率SBM模型的农村环境治理效率研究. 生态经济, 2019,35(8):194-199.
[
{{custom_citation.content}}
{{custom_citation.annotation}}
|
| [25] |
邓光耀, 张忠杰. 基于网络SBM-DEA模型和GML指数的中国各省工业用水效率研究. 自然资源学报, 2019,34(7):1457-1470.
[
{{custom_citation.content}}
{{custom_citation.annotation}}
|
| [26] |
卞纪兰, 赵桂燕. 基于DEA的黑龙江省林业产业投入产出效率评价研究. 林业经济, 2019,41(6):63-68.
[
{{custom_citation.content}}
{{custom_citation.annotation}}
|
| [27] |
{{custom_citation.content}}
{{custom_citation.annotation}}
|
| [28] |
{{custom_citation.content}}
{{custom_citation.annotation}}
|
| [29] |
张浩, 李世平, 靳亚亚, 等. 河北省耕地利用效率空间差异及影响因素. 水土保持研究, 2016,23(3):185-191.
[
{{custom_citation.content}}
{{custom_citation.annotation}}
|
| [30] |
杨朔, 于文海, 李世平. 基于DEA非有效改进的陕西省耕地生产效率研究. 中国土地科学, 2013,27(10):62-68.
[
{{custom_citation.content}}
{{custom_citation.annotation}}
|
| [31] |
经阳, 叶长盛. 基于DEA的江西省耕地利用效率及影响因素分析. 水土保持研究, 2015,22(1):257-261.
[
{{custom_citation.content}}
{{custom_citation.annotation}}
|
| [32] |
张立新, 朱道林, 谢保鹏, 等. 中国粮食主产区耕地利用效率时空格局演变及影响因素: 基于180个地级市的实证研究. 资源科学, 2017,39(4):608-619.
[
{{custom_citation.content}}
{{custom_citation.annotation}}
|
| [33] |
陈瑜琦, 李秀彬, 朱会义, 等. 不同经济发展水平地区耕地利用变化对比研究. 中国农业大学学报, 2011,16(1):124-131.
[
{{custom_citation.content}}
{{custom_citation.annotation}}
|
| [34] |
王亚辉, 李秀彬, 辛良杰, 等. 中国农地经营规模对农业劳动生产率的影响及其区域差异. 自然资源学报, 2017,32(4):539-552.
[
{{custom_citation.content}}
{{custom_citation.annotation}}
|
| [35] |
焦源. 山东省农业生产效率评价研究. 中国人口·资源与环境, 2013,23(12):105-110.
[
{{custom_citation.content}}
{{custom_citation.annotation}}
|
| [36] |
戴劲, 彭文英, 连莉, 等. 基于DEA的东北黑土区耕地利用效率研究: 以嫩江县为例. 干旱区资源与环境, 2017,31(6):38-43.
[
{{custom_citation.content}}
{{custom_citation.annotation}}
|
| [37] |
孙耀鹏, 涂维亮. 基于DEA模型的荆州市耕地资源利用效率分析. 中国农业资源与区划, 2017,38(8):93-97, 104.
[
{{custom_citation.content}}
{{custom_citation.annotation}}
|
| [38] |
姚冠荣, 刘桂英, 谢花林. 中国耕地利用投入要素集约度的时空差异及其影响因素分析. 自然资源学报, 2014,29(11):1836-1848.
[
{{custom_citation.content}}
{{custom_citation.annotation}}
|
| [39] |
罗冲, 姜博, 张文琦, 等. 东北地区耕地利用效率时空差异及其影响因素分析. 中国农业资源与区划, 2017,38(10):38-44.
[
{{custom_citation.content}}
{{custom_citation.annotation}}
|
| [40] |
卢新海, 匡兵, 李菁. 碳排放约束下耕地利用效率的区域差异及其影响因素. 自然资源学报, 2018,33(4):657-668.
[
{{custom_citation.content}}
{{custom_citation.annotation}}
|
| {{custom_ref.label}} |
{{custom_citation.content}}
{{custom_citation.annotation}}
|


 PDF(1364 KB)
/
| 〈 |
|
〉 |

 AI Summary


