 PDF(2653 KB)
 PDF(2653 KB)
PDF(2653 KB)
PDF(2653 KB)
基于生态网络效用的昭通市“三生空间”碳代谢分析
 ({{custom_author.role_cn}}), {{javascript:window.custom_author_cn_index++;}}
Analyzing the carbon metabolism of "Production-Living-Ecological" space based on ecological network utility in Zhaotong
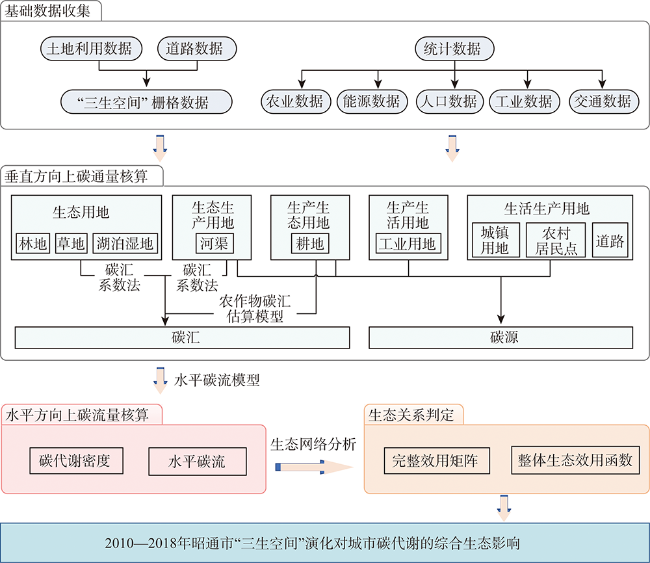
({{custom_author.role_en}}), {{javascript:window.custom_author_en_index++;}}解析“三生空间”碳代谢有助于实现区域“三生空间”要素整合和结构优化,是寻求城市绿色低碳发展的有效途径之一。以昭通市为例,通过计算垂直方向上碳通量,构建水平方向的碳流模型,系统分析了2010—2018年“三生空间”碳代谢的时空分布,利用生态网络分析方法评价了“三生空间”演化对城市碳代谢的综合影响。结果显示:(1)2010—2018年间昭通市垂直方向上净碳通量和水平方向上净碳流均为负值,“三生空间”演化对昭通市碳代谢平衡产生了消极作用,造成碳排放量的增加。(2)“三生空间”用地在碳代谢系统中的生态关系以限制掠夺关系为主,生态空间被生活空间和生产空间挤占,影响了昭通市的碳代谢平衡。(3)整体生态效用函数J的值为0.85,小于1,说明“三生空间”演化对区域整体碳代谢平衡的综合作用是消极的,这与净碳流显示的结果相同。研究结果可为昭通市国土空间利用优化与低碳发展提供理论依据,这种研究方法可为国土空间优化与“三生空间”优化提供前期支持。
Analyzing the carbon metabolism process of "Production-Living-Ecological" space could contribute to achieving the regional elements integration and structure optimization of "Production-Living-Ecological" space, which could help to strive for green and low carbon development. Taking Zhaotong as an example, this research systematically analyzed the spatial and temporal distribution of carbon metabolism in "Production-Living-Ecological" space from 2010 to 2018 through calculating vertical carbon flux between urban system and atmosphere, and building horizontal carbon flows model between components of the urban system. Besides, ecological network analysis was used to evaluate the comprehensive ecological effects of the "Production-Living-Ecological" space evolution on urban carbon metabolism. The results suggested that: (1) The vertical net carbon flux and the horizontal net carbon flows in Zhaotong from 2010 to 2018 were both negative, which indicated that "Production-Living-Ecological" space evolution had a negative influence on the urban carbon metabolism balance, resulting in an increase in carbon emissions. (2) The main ecological relationship of "Production-Living-Ecological" land in carbon metabolism system was restrictive and predatory relationship. Ecological spaces were occupied by living spaces and production spaces, leading to the imbalance of carbon metabolism. (3) The value of whole ecological utility function J was 0.85 (< 1), showing that the comprehensive effect of "Production-Living-Ecological" space pattern change on urban carbon metabolism was negative. This result was consistent with the inference of net carbon flows calculations. The study results can provide theoretical and data basis for the optimization of land space utilization and low-carbon transition in the study area, as well as decision-making support for the development of "Production-Living-Ecological" space.
“三生空间” / 碳代谢 / 碳流 / 生态网络分析 {{custom_keyword}} /
"Production-Living-Ecological" space / carbon metabolism / carbon flows / ecological network analysis {{custom_keyword}} /
表1 研究所需空间数据和统计数据Table 1 Geographic data and statistical data for this study |
| 数据类型 | 具体指标 | 简要介绍 | 来源 |
|---|---|---|---|
| 空间数据 | 土地利用数据 | 2010年和2018年全国1 km土地利用现状遥感监测数据集,包括耕地、林地、草地、水域、未利用地和城乡、工矿及居民用地6个一级地类和25个二级地类 | 中国科学院资源环境科学数据中心 |
| 道路数据 | 2010年和2018年全国道路公开历史数据 | 哥伦比亚大学的社会经济数据和应用中心、OpenStreetMap | |
| 统计数据 | 农业数据 | 包括农作物种植面积、主要农作物产量、机械总动力、灌溉面积及主要牲畜饲养量等 | 《云南统计年鉴2011》《云南统计年鉴2019》《昭通统计年鉴2010》《昭通统计年鉴2017》、 昭通市2010年国民经济和社会发展统计公报、昭通市2018年国民经济和社会发展统计公报 |
| 能源数据 | 包括不同工业能源消费量 | ||
| 人口数据 | 包括农村常住人口和城镇常住人口 | ||
| 工业数据 | 包括工业主要产品产量 | ||
| 交通数据 | 包括公路、铁路和水运的旅客周转量、货物周转量及港口货物吞吐量等 |
表2 “三生空间”分类Table 2 The "Production-Living-Ecological" space classification system |
| 三生空间分类 | 二级类 | 碳代谢计算 |
|---|---|---|
| 生态用地 | 林地 | 碳汇 |
| 草地 | 碳汇 | |
| 湖泊湿地 | 碳汇 | |
| 未利用地 | 碳汇 | |
| 生态生产用地 | 河渠 | 碳源,碳汇 |
| 生产生态用地 | 耕地 | 碳源,碳汇 |
| 生产生活用地 | 工业用地 | 碳源 |
| 生活生产用地 | 城镇用地 | 碳源 |
| 农村居民点 | 碳源 | |
| 道路 | 碳源 |
表4 耕地碳排放系数Table 4 Carbon emission coefficients of cultivated land |
| 碳排放系数 | 单位 | ||
|---|---|---|---|
| A | 857.54 | kg C/t | |
| B | 16.47 | kg C/hm2 | |
| C | 0.18 | kg C/kW | |
| D | 266.48 | kg C/hm2 | |
| 稻田CH4排放因子 | 156.2 | kg CH4/hm2 | |
| 呼吸碳排放系数 | 猪 | 301.125 | kg CO2/头/a |
| 牛 | 2920 | kg CO2/头/a | |
| 羊 | 237.25 | kg CO2/头/a | |
| 家禽 | 12.775 | kg CO2/头/a | |
| 牲畜肠道发酵CH4排放因子 | 猪 | 1 | kg CH4/hm2 |
| 牛 | 67.9 | kg CH4/hm2 | |
| 山羊 | 9.4 | kg CH4/hm2 | |
| 绵羊 | 8.7 | kg CH4/hm2 | |
| 牲畜粪便管理CH4排放因子 | 猪 | 4.18 | kg CH4/hm2 |
| 牛 | 3.21 | kg CH4/hm2 | |
| 山羊 | 0.53 | kg CH4/hm2 | |
| 绵羊 | 0.48 | kg CH4/hm2 | |
| 家禽 | 0.02 | kg CH4/hm2 | |
表5 工业用地碳排放相关系数Table 5 Coefficients of industrial land related to carbon emissions |
| 能源或工业产品类型 | 标准煤换算系数 | 单位 | CO2排放因子/kg CO2/TJ) | 碳氧化率 |
|---|---|---|---|---|
| 无烟煤 | 0.9428 | kgce/kg | 98300 | 0.94 |
| 一般烟煤 | 0.7143 | kgce/kg | 94600 | 0.93 |
| 褐煤 | 0.4286 | kgce/kg | 101000 | 0.96 |
| 其他洗煤 | 0.68215 | kgce/kg | 94600 | 0.93 |
| 焦炭 | 0.9714 | kgce/kg | 107000 | 0.93 |
| 天然气 | 1.2143 | kgce/m3 | 56100 | 0.99 |
| 汽油 | 1.4714 | kgce/kg | 74100 | 0.98 |
| 柴油 | 1.4571 | kgce/kg | 74100 | 0.98 |
| 液化石油气 | 1.7143 | kgce/kg | 63100 | 0.98 |
| 润滑油 | 1.4143 | kgce/kg | 73300 | 0.98 |
| 石油焦 | 1.0918 | kgce/kg | 97500 | 0.98 |
| 其他石油制品 | 1.4 | kgce/kg | 73300 | 0.98 |
| 电力 | 0.1229 | kgce/(kW·h) | 98800 | — |
| 生物质能 | 0.68142 | kgce/kg | 106750 | 0.96 |
| 余热余压 | 34.1 | kgce/GJ | 98800 | — |
| 水泥 | 0.376 (kg CO2/kg) | |||
| 电石 | 1.154 (kg CO2/kg) |
| 注:标准煤换算系数参考《综合能耗计算通则》(GB/T 2589-2008),能源燃烧的CO2排放因子参考《IPCC 2006 年国家温室气体清单指南2019修订版》,能源燃烧碳氧化率和水泥、电石生产过程的CO2排放因子参考《省级温室气体清单编制指南》。 |
表6 谷草比和秸秆燃烧碳排放系数Table 6 Residue to product ratios of crops and carbon emission coefficients of straw burning |
| 作物类型 | 谷草比 | 秸秆燃烧碳排放系数/(kg C/kg) |
|---|---|---|
| 稻谷 | 1 | 0.058 |
| 小麦 | 1.1 | 0.089 |
| 玉米 | 2 | 0.041 |
| 豆类 | 1.7 | 0.061 |
| 薯类 | 1 | 0.019 |
| 花生 | 1.5 | 0.04 |
| 油菜 | 3 | 0.068 |
| 其他油料 | 2 | 0.068 |
| 甘蔗 | 0.1 | 0.032 |
| 烤烟 | 1 | 0.032 |
表7 生态网络分析的生态关系分类表Table 7 Ecological relationships classification in ecological network analysis |
| 矩阵符号 | 积极(+) | 中立(0) | 消极(-) |
|---|---|---|---|
| 积极(+) | (+,+)互惠共生 | (+,0)共栖 | (+,-)掠夺 |
| 中立(0) | (0,+)共生 | (0,0)中立 | (0,-)偏害 |
| 消极(-) | (-,+)限制 | (-,0)主导 | (-,-)竞争 |
表8 2010—2018年昭通市各“三生空间”用地垂直方向上碳通量核算Table 8 Vertical carbon flux accounting for "Production-Living-Ecological" space in Zhaotong from 2010 to 2018 (t C/a) |
| 用地类型 | 2010年 | 2018年 | ||
|---|---|---|---|---|
| 碳排放率 | 碳汇率 | 碳排放率 | 碳汇率 | |
| 耕地 | 980232.89 | 1389584.74 | 901079.73 | 1713157.31 |
| 林地 | 63.34 | 61.29 | ||
| 草地 | 29.54 | 28.45 | ||
| 河渠 | 12072.98 | 0.14 | 24816.91 | 0.16 |
| 湖泊湿地 | 0.11 | 0.11 | ||
| 城镇用地 | 84318.60 | 152603.55 | ||
| 农村居民点 | 699746.05 | 770416.20 | ||
| 工业用地 | 638372.38 | 5434289.80 | ||
| 未利用地 | ||||
| 道路 | 646007.13 | 1517377.38 | ||
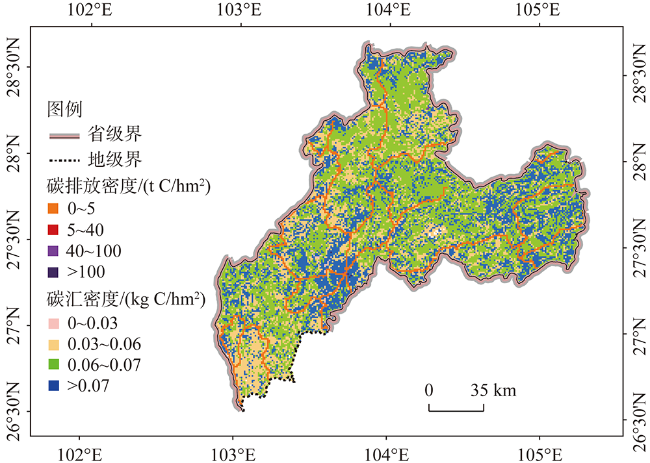
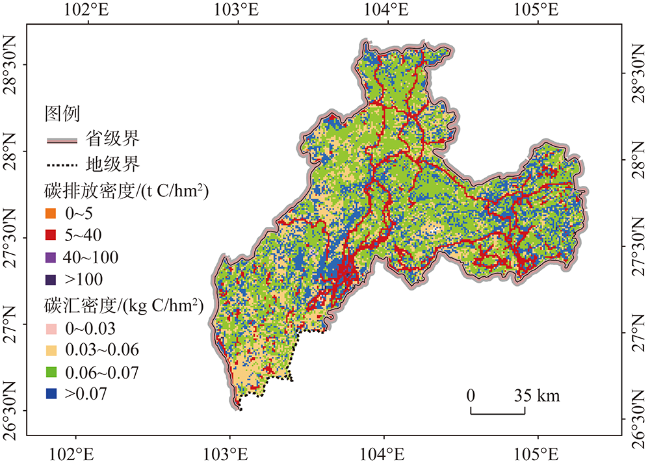
图3 2010年昭通市碳代谢密度空间分布Fig. 3 Spatial distribution of carbon metabolism density in Zhaotong in 2010 |
表9 水平方向上碳流矩阵Table 9 Horizontal carbon flows matrix (t C) |
| 2018年 | ||||||||||
|---|---|---|---|---|---|---|---|---|---|---|
| 2010年 | C | F | G | Ri | L | Ur | Ru | I | Un | T |
| C | 0 | -95483.74 | -67100.90 | -10007.11 | -872.36 | -99481.65 | -395540.75 | -1890724.61 | -201.32 | -556709.02 |
| F | 222847.54 | 0 | -0.67 | -775.54 | -0.06 | -8976.69 | -175094.79 | -1181367.38 | 0 | -322205.56 |
| G | 135059.63 | 0.72 | 0 | -8143.12 | -0.03 | -8976.69 | -134239.32 | -1653914.33 | -0.01 | -241791.61 |
| Ri | 2983.91 | 2634.15 | 4390.24 | 0 | 0 | 0 | -5616.98 | 0 | 0 | -1987.60 |
| L | 2455.69 | 0.05 | 0 | -1163.29 | 0 | 0 | -5836.49 | 0 | 0 | -5507.74 |
| Ur | 0 | 7665.33 | 0 | 7277.57 | 0 | 0 | 0 | 0 | 0 | 56916.44 |
| Ru | 200234.41 | 0 | 99963.73 | 99575.96 | 0 | 0 | 0 | 0 | 0 | 198825.90 |
| I | 0 | 0 | 0 | 0 | 0 | 0 | 0 | 0 | 0 | 318084.65 |
| Un | 1381.35 | 0 | 0.04 | 0 | 0 | 0 | 0 | 0 | 0 | -550.77 |
| T | 152051.12 | 95706.31 | 106250.07 | 106.60 | 1216.59 | -25713.45 | -48878.62 | -235867.94 | 0 | 0 |
| 注:C:耕地;F:林地;G:草地;Ri:河渠;L:湖泊湿地;Ur:城镇用地;Ru:农村居民点;I:工业用地;Un:未利用地;T:道路。 |
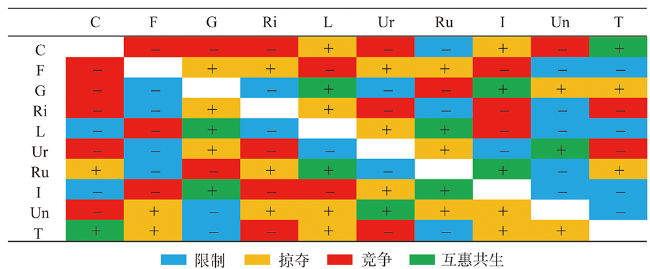
图5 2010—2018年昭通市“三生空间”用地生态关系注:“+/-”表示完整效用矩阵U中元素的正负。Fig. 5 Ecological relationships between components of the network in Zhaotong from 2010 to 2018 |
表10 2010—2018年昭通市“三生空间”用地生态关系分布表Table 10 The distribution of ecological relationships between "Production-Living-Ecological" space in Zhaotong from 2010 to 2018 |
| “三生”用地类型 | C | F | G | Ri | L | Ur | Ru | I | Un | T |
|---|---|---|---|---|---|---|---|---|---|---|
| 竞争关系 | 5 | 3 | 2 | 4 | 2 | 3 | 1 | 3 | 1 | 2 |
| 限制掠夺关系 | 3 | 6 | 5 | 5 | 5 | 5 | 6 | 4 | 7 | 6 |
| 互惠共生关系 | 1 | 0 | 2 | 0 | 2 | 1 | 2 | 2 | 1 | 1 |
| [1] |
{{custom_citation.content}}
{{custom_citation.annotation}}
|
| [2] |
方创琳. 中国城市发展格局优化的科学基础与框架体系. 经济地理, 2013,33(12):1-9.
[
{{custom_citation.content}}
{{custom_citation.annotation}}
|
| [3] |
武占云. “三生”空间优化及京津冀生态环境保护. 城市, 2014, ( 12):26-29.
[
{{custom_citation.content}}
{{custom_citation.annotation}}
|
| [4] |
黄金川, 林浩曦, 漆潇潇. 面向国土空间优化的三生空间研究进展. 地理科学进展, 2017,36(3):378-391.
解决经济高速增长、社会快速转型中存在的国土开发秩序混乱和资源环境代价沉重等问题是人文—经济地理学在区域可持续发展领域的重大科学命题。党的十八大报告将优化国土空间开发格局作为生态文明建设的首要举措,并提出“促进生产空间集约高效、生活空间宜居适度、生态空间山清水秀”,由此构成的“三生”空间成为构建空间规划体系、完善国土空间开发保护制度和各类尺度空间落实主体功能区规划的重要基础。本文围绕国土空间优化和区域可持续发展目标,对国内外“三生”空间相关文献进行系统梳理,紧紧围绕“三生”空间的数量配比和空间配置两个科学问题进行综述,按照精度深化和尺度细化的要求,集中在“三生”功能分类、空间识别、空间优化等内容,从而勾勒出三生空间研究的框架体系。今后应重视三生空间动态演化,促进各尺度适宜性评价的统一和整合,响应“多规合一”的实践需求,最终服务于国土空间格局优化。
[
{{custom_citation.content}}
{{custom_citation.annotation}}
|
| [5] |
张红旗, 许尔琪, 朱会义. 中国“三生用地”分类及其空间格局. 资源科学, 2015,37(7):1332-1338.
[
{{custom_citation.content}}
{{custom_citation.annotation}}
|
| [6] |
李广东, 方创琳. 城市生态—生产—生活空间功能定量识别与分析. 地理学报, 2016,71(1):49-65.
土地利用多功能性识别是城市用地组织,协调与配置的基础信息源,是判定城市用地内在功能形态,功能组合模式和功能之间动态权衡的关键,具有重要的理论和实践意义,但长期以来并未构建一套可行的识别方法体系.本文从土地功能,生态系统服务和景观功能综合的视角构建城市生态--生产--生活空间功能分类体系,并以生态系统服务价值评估为基础系统整合空间功能价值量核算函数群,通过纵横对比的方法确定空间功能主导类型.研究区实证分析表明,城市生态--生产--生活功能分类体系较好反映了不同地类的功能类型;空间主导功能的识别也与不同地类的功能匹配;同时也发现三生空间的整体毗邻性较低,空间功能的互补和融合性较差的问题;三生空间功能存在一定的空间集聚性.
[
{{custom_citation.content}}
{{custom_citation.annotation}}
|
| [7] |
李欣, 方斌, 殷如梦, 等. 江苏省县域“三生”功能时空变化及协同/权衡关系. 自然资源学报, 2019,34(11):2363-2377.
[
{{custom_citation.content}}
{{custom_citation.annotation}}
|
| [8] |
吴艳娟, 杨艳昭, 杨玲, 等. 基于"三生空间"的城市国土空间开发建设适宜性评价: 以宁波市为例. 资源科学, 2016,38(11):2072-2081.
[
{{custom_citation.content}}
{{custom_citation.annotation}}
|
| [9] |
张磊, 陈晓琴, 董晓翠, 等. 三生互斥视角下工业用地空间布局优化: 以天津市为例. 地理与地理信息科学, 2019,35(3):112-119.
[
{{custom_citation.content}}
{{custom_citation.annotation}}
|
| [10] |
韩青, 孙中原, 孙成苗, 等. 基于自然资源本底的国土空间规划现状一张图构建及应用: 以青岛市为例. 自然资源学报, 2019,34(10):2150-2162.
[
{{custom_citation.content}}
{{custom_citation.annotation}}
|
| [11] |
夏楚瑜. 基于土地利用视角的多尺度城市碳代谢及“减排”情景模拟研究. 杭州: 浙江大学, 2019.
[
{{custom_citation.content}}
{{custom_citation.annotation}}
|
| [12] |
{{custom_citation.content}}
{{custom_citation.annotation}}
|
| [13] |
{{custom_citation.content}}
{{custom_citation.annotation}}
|
| [14] |
{{custom_citation.content}}
{{custom_citation.annotation}}
|
| [15] |
{{custom_citation.content}}
{{custom_citation.annotation}}
|
| [16] |
夏楚瑜, 李艳, 叶艳妹, 等. 基于生态网络效用的城市碳代谢空间分析: 以杭州为例. 生态学报, 2018,38(1):73-85.
[
{{custom_citation.content}}
{{custom_citation.annotation}}
|
| [17] |
梁育填, 樊杰, 孙威, 等. 西南山区农村生活能源消费结构的影响因素分析: 以云南省昭通市为例. 地理学报, 2012,67(2):221-229.
能源是贫困地区农户赖以生产和发展的基本生计资产,过度采伐薪柴的能源消费行为是加剧生态脆弱地区水土流失、土壤侵蚀、森林植被破坏的重要因素。西南山区既是我国贫困地区,又是生态环境脆弱地区,本文选取在西南山区经济发展水平和生态脆弱性都具有代表性的云南省昭通市为案例,基于946 份调查问卷,采用Tobit 模型对非商品性能源和商品性能源的消费比例的影响因素进行回归分析,并得出以下结论:① 地形特征对西南山区农村能源消费结构影响显著,薪柴和秸秆等非商品性能源受资源禀赋影响显著,而煤炭等商品性能源更多的是受市场距离影响。② 随着家庭人均收入的增加,非商品性能源消费比例将下降,煤炭和电力等商品性能源消费比例将上升,但是西南贫困地区由于农户生计资产有限,收入增长缓慢,能源消费结构升级艰难。③ 家庭人均教育程度的提高、从事非农产业有助于西南山区农户增加商品性能源的消费比例,从而提升能源消费结构。
[
{{custom_citation.content}}
{{custom_citation.annotation}}
|
| [18] |
刘继来, 刘彦随, 李裕瑞 . 中国 “三生空间” 分类评价与时空格局分析. 地理学报, 2017,72(7):1290-1304.
本文在探究“生产—生活—生态”三生空间理论内涵的基础上,分析了土地利用功能与土地利用类型的辩证关系,依据土地利用现状分类国家标准,建立了三生空间分类与评价体系,揭示了1990-2010年间中国三生空间的格局及其变化特征。结果表明:① 生产空间主要分布在胡焕庸线东南侧的主要城市群及粮食主产区,其扩张区域主要分布于东北平原、新疆西北、宁夏、兰州—西宁、四川盆地、环渤海、长三角、厦漳泉、珠三角等地区,缩小区域主要分布在黄土高原、呼伦贝尔大草原、江汉平原、闽南丘陵等地区;② 生活空间主要集中在全国主要城市及城市群,整体上呈现“东高西低、北高南低;大分散、小集聚”的空间格局,其扩张过程表现为环渤海、长三角、珠三角三大城市群的大规模、区域式扩张和各主要省会城市的小规模、点状式扩张。③ 生态空间主要分布在胡焕庸线西北侧,整体呈现“西高东低,南高北低”的空间格局;④ 工业化、城镇化是中国三生空间变化的基本动力,西北和东北地区的农田开垦、华北平原和三大城市群的城镇化建设、黄土高原的退耕还林等是导致三生空间区域差异的主要原因。本文可以为三生空间的分类规划和优化决策提供参考依据。
[
{{custom_citation.content}}
{{custom_citation.annotation}}
|
| [19] |
邹利林, 王建英, 胡学东. 中国县级“三生用地”分类体系的理论构建与实证分析. 中国土地科学, 2018,32(4):59-66.
[
{{custom_citation.content}}
{{custom_citation.annotation}}
|
| [20] |
刘超, 许月卿, 刘焱序, 等. 基于系统论的土地利用多功能分类及评价指标体系研究. 北京大学学报: 自然科学版, 2018,54(1):181-188.
[
{{custom_citation.content}}
{{custom_citation.annotation}}
|
| [21] |
方精云, 郭兆迪, 朴世龙, 等. 1981—2000年中国陆地植被碳汇的估算. 中国科学: D辑: 地球科学, 2007,37(6):804-812.
[
{{custom_citation.content}}
{{custom_citation.annotation}}
|
| [22] |
赵亮. 城镇区域碳源碳汇时空格局研究: 以银川平原城镇区域为例. 西安: 西北大学, 2012.
[
{{custom_citation.content}}
{{custom_citation.annotation}}
|
| [23] |
段晓男, 王效科, 逯非, 等. 中国湿地生态系统固碳现状和潜力. 生态学报, 2008,28(2):13-19.
[
{{custom_citation.content}}
{{custom_citation.annotation}}
|
| [24] |
{{custom_citation.content}}
{{custom_citation.annotation}}
|
| [25] |
田云, 张俊飚. 中国农业生产净碳效应分异研究. 自然资源学报, 2013,28(8):1298-1309.
[
{{custom_citation.content}}
{{custom_citation.annotation}}
|
| [26] |
何坚坚. 基于土地利用变化的黄河下游开封段背河洼地区碳排放测算与模拟研究. 开封: 河南大学, 2019.
[
{{custom_citation.content}}
{{custom_citation.annotation}}
|
| [27] |
解天荣, 王静. 交通运输业碳排放量比较研究. 综合运输, 2011, ( 8):20-24.
[
{{custom_citation.content}}
{{custom_citation.annotation}}
|
| [28] |
蔡博峰, 曹东, 刘兰翠, 等. 中国交通二氧化碳排放研究. 气候变化研究进展, 2011,7(3):197-203.
[
{{custom_citation.content}}
{{custom_citation.annotation}}
|
| [29] |
彭传圣. 港口生产能耗和排放计算问题研究. 港口装卸, 2011, ( 6):25-30.
[
{{custom_citation.content}}
{{custom_citation.annotation}}
|
| [30] |
赵荣钦, 秦明周. 中国沿海地区农田生态系统部分碳源/汇时空差异. 生态与农村环境学报, 2007,23(2):1-6, 13.
[
{{custom_citation.content}}
{{custom_citation.annotation}}
|
| [31] |
{{custom_citation.content}}
{{custom_citation.annotation}}
|
| [32] |
陶在朴. 生态包袱与生态足迹: 可持续发展的重量及面积观念. 北京: 经济科学出版社, 2003: 45.
[
{{custom_citation.content}}
{{custom_citation.annotation}}
|
| [33] |
匡耀求, 欧阳婷萍, 邹毅, 等. 广东省碳源碳汇现状评估及增加碳汇潜力分析. 中国人口·资源与环境, 2010,20(12):56-61.
[
{{custom_citation.content}}
{{custom_citation.annotation}}
|
| [34] |
刘刚, 沈镭. 中国生物质能源的定量评价及其地理分布. 自然资源学报, 2007,22(1):9-19.
[
{{custom_citation.content}}
{{custom_citation.annotation}}
|
| [35] |
刘鹏举. 昆明市景观格局变化及其对碳源碳汇的影响研究. 昆明: 云南大学, 2019.
[
{{custom_citation.content}}
{{custom_citation.annotation}}
|
| [36] |
{{custom_citation.content}}
{{custom_citation.annotation}}
|
| [37] |
{{custom_citation.content}}
{{custom_citation.annotation}}
|
| [38] |
{{custom_citation.content}}
{{custom_citation.annotation}}
|
| [39] |
刘耕源, 杨志峰, 陈彬, 等. 基于生态网络的城市代谢结构模拟研究: 以大连市为例. 生态学报, 2013,33(18):5926-5934.
[
{{custom_citation.content}}
{{custom_citation.annotation}}
|
| {{custom_ref.label}} |
{{custom_citation.content}}
{{custom_citation.annotation}}
|


 PDF(2653 KB)
 表1 研究所需空间数据和统计数据表2 “三生空间”分类
 图1 2018年昭通市“三生空间”用地分类图2 昭通市“三生空间”碳代谢分析的技术路线表3 生态用地和生态生产用地的碳汇系数表4 耕地碳排放系数表5 工业用地碳排放相关系数表6 谷草比和秸秆燃烧碳排放系数表7 生态网络分析的生态关系分类表表8 2010—2018年昭通市各“三生空间”用地垂直方向上碳通量核算图3 2010年昭通市碳代谢密度空间分布图4 2018年昭通市碳代谢密度空间分布表9 水平方向上碳流矩阵图5 2010—2018年昭通市“三生空间”用地生态关系表10 2010—2018年昭通市“三生空间”用地生态关系分布表
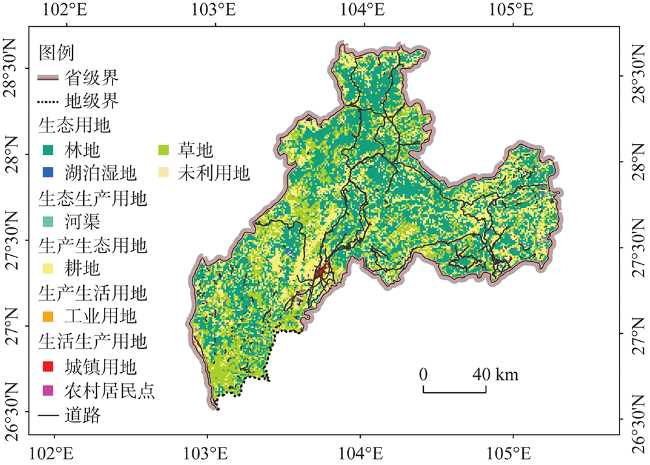
/
| 〈 |
|
〉 |

 AI Summary

