 PDF(3688 KB)

2015年厄尔尼诺年东南亚主要国家活跃火发生类型与影响分析
李文君, 肖池伟, 封志明, 李鹏, 祁月基
自然资源学报 ›› 2020, Vol. 35 ›› Issue (10) : 2539-2552.
PDF(3688 KB)
PDF(3688 KB)
2015年厄尔尼诺年东南亚主要国家活跃火发生类型与影响分析
Occurrence types and impact analysis of active fires in the major countries of Southeast Asia during the 2015 strong El Nino
 ({{custom_author.role_en}}), {{javascript:window.custom_author_en_index++;}}
2015年强厄尔尼诺引起东南亚干旱少雨与活跃火加剧,但目前有关活跃火时空特征、发生类型与强度及其对人口—社会经济影响仍分析不足。利用美国国家航空航天局火灾信息资源管理系统(FIRMS)VIIRS V1活跃火位置矢量产品,通过月际、地形、土地覆被类型等GIS分析确定东南亚主要国家活跃火主要类型,并评价各国活跃火对人口分布的影响范围与国别差异。结果表明:(1)东南亚2015年活跃火发生频次达81.40×10⁵次,中南半岛与马来群岛各占69.60%与30.40%,分别集中发生在2-4月与8-10月,各国活跃火频次与发生时间差异很大。(2)中南半岛五国活跃火地形差异明显,缅甸和越南活跃火集中分布于25 m以下;老挝(85~105 m、140~200 m)、泰国(5~15 m、70~110 m)和柬埔寨(5~15 m、70~110 m)活跃火随海拔呈双峰特征;马来群岛国家(印度尼西亚、马来西亚与菲律宾)活跃火集中分布于60 m以下的平原地带;且东南亚35%以上的活跃火均集中分布5~15°的斜坡。(3)东南亚森林、农田活跃火发生率为76%,其中森林活跃火发生率由柬埔寨的52.00%到老挝的74.27%不等,农田活跃火由老挝的13.18%到泰国的42.68%不等。(4)综合活跃火发生月份、海拔、坡度与覆被特征,可从山区刀耕火种农业与平原秸秆焚烧界定东南亚主要国家活跃火发生类型。(5)东南亚活跃火随人口密度增加呈先增后减至平稳变化的趋势,且多集中于人口稀少的乡村和原始森林,其中缅甸、泰国、越南三国有10%以上的活跃火发生在人口密度为72~91人/km2的区域,而马来西亚、老挝、柬埔寨、印度尼西亚30%以上的活跃火集中发生于人口密度在20人/km2以下的区域。
The strong El Nino in 2015 caused droughts, little rainfall and intensified active fires in Southeast Asia (SEA). To our knowledge, the spatio-temporal characteristics, occurrence types and intensity of active fires as well as their impacts on population and socio-economy have not been fully analyzed. In this paper, we used the active fire data (point in Shapefile format) derived from Visible Infrared Imaging Radiometer Suite (VIIRS) Version 1 (V1) provided by the NASA's Fire Information for Resource Management System (FIRMS), the Advanced Spaceborne Thermal Emission and Reflection Radiometer (ASTER) Global Digital Elevation Model (GDEM, 30 m, V2), Global Land Cover products (30 m, 2015), and Gridded Population of the World (GPW, 1 km, V4, 2015). On this basis, GIS-based monthly, topographical, and land-cover category analyses of VIIRS active fires were comprehensively applied to determine the major occurrence types of active fires at national scale, followed by impact evaluation of active fires on national population density in the major counties of Southeast Asia (excluding Brunei, East Timor, and Singapore). The results showed that: (1) The active fire frequency in SEA reached 81.40×10⁵ in 2015, with Mainland Southeast Asia (MSEA) and Insular Southeast Asia (ISEA) accounting for 69.60% and 30.40%, respectively. Active fires in MSEA and ISEA mainly occurred in the periods of February to April and August to October, respectively. There were huge differences in the occurrence frequency and timing of active fires. (2) The topographical features of active fires were quite different in MSEA. Specifically, active fires in Myanmar and Vietnam were distributed at the elevations below 25 m, while those in Laos (85-105 m and 140-200 m), Thailand (5-15 m and 70-110 m) and Cambodia (5-15 m and 70-110 m) showed consistently a bimodal pattern. The ISEA's active fires were primarily distributed in the plains below 60 m. Additionally, over 35% of the occurrence frequency of active fires was mainly observed in the slope range of 5-15. (3) The frequency proportion of active fires in forests and farmland in SEA was estimated to be 76%. Among them, the figures in forests increased from 52.00% in Cambodia to 74.27% in Laos, while those in farmland increased from 13.18% in Laos to 42.68% in Thailand. (4) Combining the comprehensive features of active fires in occurrence timing, elevation, slope and land cover types, national occurrence types of active fires could be discriminated in two aspects, namely upland swidden agriculture and open burning of crop residues in the plain area. (5) With the increment of population density, the occurrence frequency of active fires first increased and then decreased to a stable level in SEA, and active fires mostly concentrated in the sparsely populated countryside and natural forests. Specifically, over 10% of the occurrence frequency of active fires were located in the areas with the population density ranging from 72 to 91 p/km2 in Myanmar, Thailand, and Vietnam, while more than 30% of the active fire counts were found in Malaysia, Laos, Cambodia, and Indonesia, where the population density was below 20 p/km2.
厄尔尼诺 / 活跃火 / 地形 / 土地覆被 / 发生类型 / 人口密度 {{custom_keyword}} /
El Nino / active fires / topography / land cover / occurrence types / population density {{custom_keyword}} /
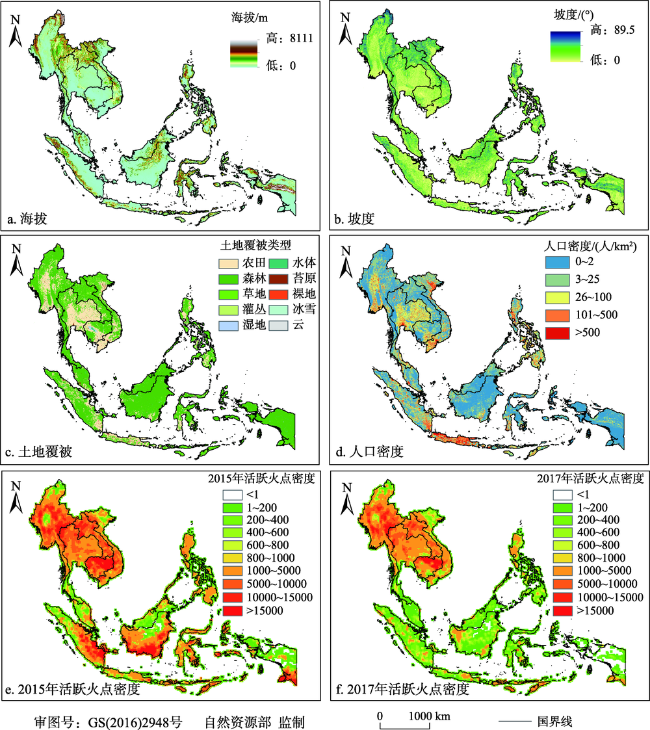
图1 东南亚研究区概况 |
表1 东南亚8个主要国家地形、土地覆被及人口密度Table 1 Topography, land cover types, and population density of the eight major Southeast Asia (SEA) countries |
| 国家 | 值/类型 | 老挝 | 缅甸 | 柬埔寨 | 泰国 | 越南 | 菲律宾 | 印度尼西亚 | 马来西亚 |
|---|---|---|---|---|---|---|---|---|---|
| 海拔/m | 均值 | 671.10 | 590.17 | 123.56 | 283.85 | 395.9 | 330.68 | 346.08 | 281.18 |
| 坡度/(°) | 最大值 | 78.75 | 89.15 | 72.26 | 86.27 | 89.36 | 89.52 | 89.54 | 89.43 |
| 均值 | 14.91 | 12.97 | 5.60 | 8.23 | 12.16 | 11.85 | 9.64 | 11.38 | |
| 人口密度/ (人/km2) | 最小值 | 0.18 | 0.06 | 0.38 | 0.03 | 5.89 | 0.23 | 0.85 | 0.01 |
| 最大值 | 31118 | 39864 | 61774 | 22384 | 55175 | 126446 | 22277 | 11275 | |
| 均值 | 30.88 | 74.77 | 91.84 | 137.03 | 286.83 | 346.27 | 138.1 | 93.23 | |
| 土地覆被 类型/% | 农田 | 9.43 | 25.86 | 33.42 | 50.72 | 38.58 | 22.22 | 13.68 | 7.27 |
| 森林 | 80.88 | 64.29 | 55.93 | 41.64 | 49.41 | 67.49 | 78.09 | 86.10 | |
| 草地 | 8.38 | 5.74 | 3.14 | 4.29 | 6.29 | 6.49 | 3.84 | 1.89 | |
| 灌木 | 0.17 | 1.33 | 0 | 0 | 1.59 | 0.03 | 0 | 0 | |
| 湿地 | 0.17 | 0.64 | 4.17 | 0.62 | 0.49 | 0.89 | 1.85 | 1.84 | |
| 水体 | 0.85 | 1.20 | 2.66 | 1.67 | 1.66 | 1.53 | 1.34 | 0.91 |
表3 东南亚8个主要国家坡度的活跃火发生频率Table 3 Distribution characteristics of active fire frequency on different slopes in the eight major Southeast Asia (SEA) countries (%) |
| 坡度 | 东南亚 | 老挝 | 缅甸 | 泰国 | 越南 | 柬埔寨 | 菲律宾 | 印度尼西亚 | 马来西亚 |
|---|---|---|---|---|---|---|---|---|---|
| 平原 | 19.25 | 4.34 | 8.34 | 12.45 | 10.78 | 15.60 | 6.73 | 30.31 | 21.67 |
| 缓斜坡 | 26.61 | 15.58 | 17.79 | 27.26 | 16.87 | 42.35 | 16.77 | 29.29 | 29.84 |
| 斜坡 | 35.51 | 39.70 | 39.40 | 35.01 | 35.41 | 39.72 | 42.02 | 31.77 | 37.28 |
| 陡坡 | 12.33 | 26.74 | 21.71 | 17.09 | 23.43 | 2.05 | 22.35 | 6.05 | 8.87 |
| 急坡 | 4.92 | 11.19 | 10.04 | 6.75 | 10.61 | 0.26 | 9.26 | 1.80 | 1.88 |
| 急陡坡 | 1.35 | 2.44 | 2.70 | 1.43 | 2.86 | 0.02 | 2.85 | 0.73 | 0.44 |
| 垂直坡 | 0.03 | 0.02 | 0.02 | 0.01 | 0.04 | 0.00 | 0.02 | 0.05 | 0.02 |
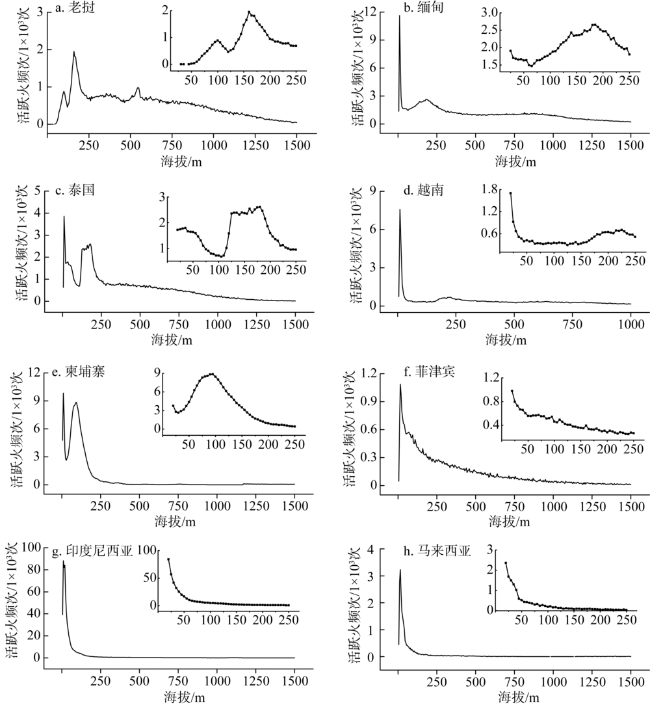
图3 东南亚8个主要国家活跃火频次海拔分布特征Fig. 3 Elevational characteristics of active fire frequency in the eight major Southeast Asia (SEA) countries |
表2 东南亚8个主要国家地形类型的活跃火发生频率Table 2 Topographical characteristics of active fire frequency in the eight major Southeast Asia (SEA) countries (%) |
| 地形 | 东南亚 | 老挝 | 缅甸 | 泰国 | 越南 | 柬埔寨 | 菲律宾 | 印度尼西亚 | 马来西亚 |
|---|---|---|---|---|---|---|---|---|---|
| 平原 | 53.84 | 15.82 | 27.10 | 40.30 | 32.36 | 91.99 | 45.14 | 89.18 | 88.85 |
| 丘陵 | 19.79 | 29.33 | 24.35 | 27.76 | 27.30 | 6.57 | 29.38 | 5.26 | 8.34 |
| 低山 | 19.00 | 40.19 | 29.94 | 27.01 | 29.46 | 1.42 | 18.64 | 2.80 | 2.56 |
| 高山/高原 | 7.37 | 14.66 | 18.61 | 4.93 | 10.88 | 0.02 | 6.84 | 2.76 | 0.25 |
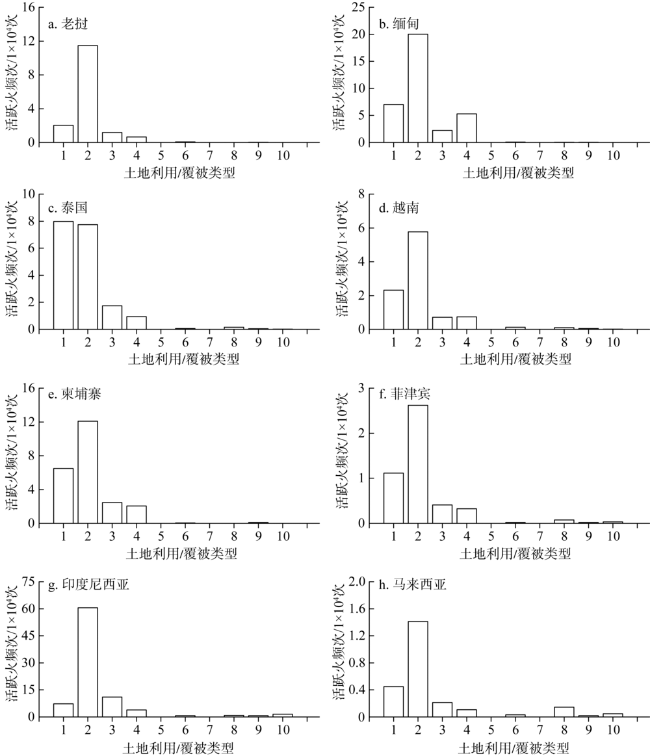
表4 东南亚8个主要国家二级土地覆被类型的活跃火发生频率Table 4 Distribution characteristics of active fire frequency of varied land cover types (Level-2) in the eight major Southeast Asia (SEA) countries (%) |
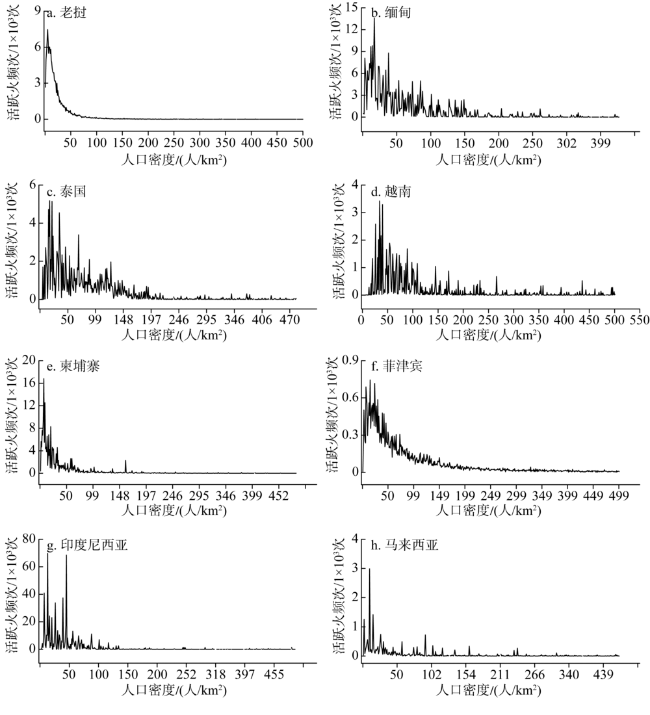
图5 东南亚8国活跃火频次与人口密度相关性分析Fig. 5 Correlation analysis between the occurrence frequency of active fires and population density in the eight major Southeast Asia (SEA) countries |
| [1] |
{{custom_citation.content}}
{{custom_citation.annotation}}
|
| [2] |
{{custom_citation.content}}
{{custom_citation.annotation}}
|
| [3] |
{{custom_citation.content}}
{{custom_citation.annotation}}
|
| [4] |
{{custom_citation.content}}
{{custom_citation.annotation}}
|
| [5] |
{{custom_citation.content}}
{{custom_citation.annotation}}
|
| [6] |
[
{{custom_citation.content}}
{{custom_citation.annotation}}
|
| [7] |
[
{{custom_citation.content}}
{{custom_citation.annotation}}
|
| [8] |
[
{{custom_citation.content}}
{{custom_citation.annotation}}
|
| [9] |
[
{{custom_citation.content}}
{{custom_citation.annotation}}
|
| [10] |
{{custom_citation.content}}
{{custom_citation.annotation}}
|
| [11] |
{{custom_citation.content}}
{{custom_citation.annotation}}
|
| [12] |
{{custom_citation.content}}
{{custom_citation.annotation}}
|
| [13] |
{{custom_citation.content}}
{{custom_citation.annotation}}
|
| [14] |
{{custom_citation.content}}
{{custom_citation.annotation}}
|
| [15] |
{{custom_citation.content}}
{{custom_citation.annotation}}
|
| [16] |
{{custom_citation.content}}
{{custom_citation.annotation}}
|
| [17] |
{{custom_citation.content}}
{{custom_citation.annotation}}
|
| [18] |
{{custom_citation.content}}
{{custom_citation.annotation}}
|
| [19] |
[
{{custom_citation.content}}
{{custom_citation.annotation}}
|
| [20] |
{{custom_citation.content}}
{{custom_citation.annotation}}
|
| [21] |
{{custom_citation.content}}
{{custom_citation.annotation}}
|
| [22] |
{{custom_citation.content}}
{{custom_citation.annotation}}
|
| [23] |
{{custom_citation.content}}
{{custom_citation.annotation}}
|
| [24] |
{{custom_citation.content}}
{{custom_citation.annotation}}
|
| [25] |
{{custom_citation.content}}
{{custom_citation.annotation}}
|
| [26] |
{{custom_citation.content}}
{{custom_citation.annotation}}
|
| [27] |
{{custom_citation.content}}
{{custom_citation.annotation}}
|
| [28] |
{{custom_citation.content}}
{{custom_citation.annotation}}
|
| [29] |
{{custom_citation.content}}
{{custom_citation.annotation}}
|
| [30] |
{{custom_citation.content}}
{{custom_citation.annotation}}
|
| [31] |
{{custom_citation.content}}
{{custom_citation.annotation}}
|
| [32] |
{{custom_citation.content}}
{{custom_citation.annotation}}
|
| [33] |
[
{{custom_citation.content}}
{{custom_citation.annotation}}
|
| [34] |
[
{{custom_citation.content}}
{{custom_citation.annotation}}
|
| [35] |
{{custom_citation.content}}
{{custom_citation.annotation}}
|
| [36] |
[
{{custom_citation.content}}
{{custom_citation.annotation}}
|
| {{custom_ref.label}} |
{{custom_citation.content}}
{{custom_citation.annotation}}
|


 PDF(3688 KB)
 图1 东南亚研究区概况注:本图基于自然资源部标准地图服务系统下载的标准地图制作,底图无修改。
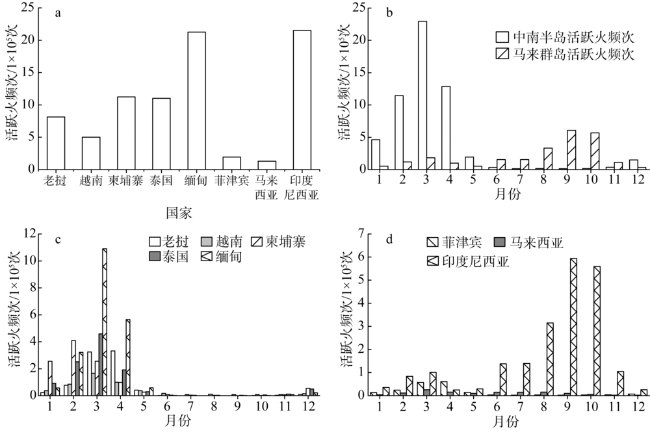
 表1 东南亚8个主要国家地形、土地覆被及人口密度表3 东南亚8个主要国家坡度的活跃火发生频率图2 东南亚8个主要国家活跃火频次时间(逐月)分布特征图3 东南亚8个主要国家活跃火频次海拔分布特征表2 东南亚8个主要国家地形类型的活跃火发生频率图4 东南亚8个主要国家一级土地覆被类型对应活跃火频次分布特征表4 东南亚8个主要国家二级土地覆被类型的活跃火发生频率图5 东南亚8国活跃火频次与人口密度相关性分析
/
| 〈 |
|
〉 |

 AI Summary

