 PDF(2917 KB)
 PDF(2917 KB)
PDF(2917 KB)
PDF(2917 KB)
科技创新、产业结构升级与碳排放效率——基于省际面板数据的PVAR分析
 ({{custom_author.role_cn}}), {{javascript:window.custom_author_cn_index++;}}
Technological innovation, industrial structure upgrading and carbon emissions efficiency: An analysis based on PVAR model of panel data at provincial level
({{custom_author.role_en}}), {{javascript:window.custom_author_en_index++;}}基于PVAR模型,以我国30个省(市、自治区)2010—2018年数据为例,从全国和东中西区域层面分析科技创新、产业结构升级与碳排放效率的动态关系。结果表明:(1)从全国层面看,科技创新、产业结构升级与碳排放效率自身具有较强的协调性且相互间能够产生正向的促进作用。(2)从区域内部来看,自东向西,科技创新、产业结构升级与碳排放效率的协调程度逐步递减。东部地区基本实现了三个变量的协调发展,中部地区产业结构升级与碳排放效率尚未形成双向互动关系,碳排放效率对产业结构升级提升的推动力不足;西部地区科技创新水平偏低,产业结构不合理、碳排放效率较低,三者均未形成良性互动。
Based on the 2010-2018 Chinese provincial panel data, a PVAR model is constructed to analyze the dynamic relationship between technological innovation, industrial structure upgrading and carbon emissions efficiency at the national and regional levels. The results show that: (1) From the national level, technological innovation, industrial structure upgrading and carbon emissions efficiency have strong self-coordination and mutual positive promotion; (2) From the regional level, from east to west, technological innovation, industrial structure upgrading and carbon emissions efficiency of coordination degree decrease, the eastern region have basically achieved the coordinated development of the three variables, industrial structure upgrade and carbon emissions efficiency in the central region have not yet formed a two-way interaction, carbon emissions efficiency has insufficient impetus to improve industrial structure upgrade. In the western region, the level of technological innovation is low, the industrial structure is unreasonable, and the carbon emissions efficiency is low as well. There is no positive interaction among the three factors in Western China.
科技创新 / 产业结构升级 / 碳排放效率 / PVAR模型 {{custom_keyword}} /
technological innovation / industrial structure upgrading / carbon emissions / PVAR model {{custom_keyword}} /
表1 我国省域科技创新水平评价指标体系Table 1 Evaluation index system of provincial science and technology innovation index in China |
| 一级指标 | 二级指标 | 三级指标 | 单位 | 指标权重 |
|---|---|---|---|---|
| 科技创新 | 创新投入 | R&D人员全时当量 | 人 | 0.0651 |
| R&D经费投入强度 | % | 0.0403 | ||
| 科学研究和技术服务业新增固定资产占全社会新增固定资产比例 | % | 0.0817 | ||
| R&D项目(课题)数 | 项 | 0.0895 | ||
| 创新产出 | 国内三种专利申请授权数 | 件 | 0.0930 | |
| 高新技术企业新产品开发项目数 | 个 | 0.1017 | ||
| 国外主要检索工具收录我国科技论文数 | 篇 | 0.0672 | ||
| 技术市场成交额 | 亿元 | 0.1389 | ||
| 创新环境 | 研究与开发机构数量 | 个 | 0.0278 | |
| 互联网普及率 | % | 0.0151 | ||
| 地方财政科技拨款占财政总支出比例 | % | 0.1015 | ||
| 高技术产业企业数量 | 个 | 0.0914 | ||
| 规模以上工业企业R&D经费内部支出额中获得金融机构贷款额 | 万元 | 0.0868 |
表2 我国省域产业结构升级水平评价指标体系Table 2 Evaluation index system of provincial industrial structure upgrading index in China |
| 一级指标 | 二级指标 | 三级指标 | 单位 | 指标权重 |
|---|---|---|---|---|
| 产业结构升级 | 产业结构合理化 | 泰尔指数 | / | 0.1326 |
| 产业结构高级化 | 高新技术产业占GDP比例 | % | 0.1564 | |
| 第二三产业产值占GDP比例 | % | 0.1144 | ||
| 产业结构高效化 | 第二产业投入产出比 | / | 0.0846 | |
| 第三产业投入产出比 | / | 0.1870 | ||
| 第二产业人均产值 | 亿元/万人 | 0.1488 | ||
| 第三产业人均产值 | 亿元/万人 | 0.1762 |
表3 变量描述性统计分析Table 3 Descriptive statistical analysis of variables |
| 变量 | 样本数/个 | 均值 | 标准差 | 最小值 | 中位数 | 最大值 | |
|---|---|---|---|---|---|---|---|
| 全国 | INNO | 270 | 0.1064 | 0.1067 | 0.0075 | 0.0700 | 0.5770 |
| IS | 270 | 0.0873 | 0.0890 | 0.0269 | 0.0590 | 0.7666 | |
| CEF | 270 | 0.7642 | 0.2194 | 0.5110 | 0.7172 | 1.8509 | |
| 东部 | INNO | 99 | 0.1879 | 0.1362 | 0.0078 | 0.1507 | 0.5770 |
| IS | 99 | 0.1415 | 0.1281 | 0.0385 | 0.1102 | 0.7666 | |
| CEF | 99 | 0.9269 | 0.2715 | 0.6414 | 0.8273 | 1.8509 | |
| 中部 | INNO | 72 | 0.0764 | 0.0316 | 0.0344 | 0.0694 | 0.1779 |
| IS | 72 | 0.0560 | 0.0231 | 0.0330 | 0.0516 | 0.2248 | |
| CEF | 72 | 0.7094 | 0.0811 | 0.5646 | 0.7184 | 0.8492 | |
| 西部 | INNO | 99 | 0.0468 | 0.0328 | 0.0075 | 0.0352 | 0.1501 |
| IS | 99 | 0.0560 | 0.0168 | 0.0269 | 0.0524 | 0.1228 | |
| CEF | 99 | 0.6413 | 0.0975 | 0.5110 | 0.6098 | 0.9700 |
表4 不同准则下模型滞后期选择Table 4 Selection of model lag period under different criteria |
| Area | Lag | AIC | BIC | HQIC |
|---|---|---|---|---|
| 全国 | 1 | -6.8629* | -5.9589* | -6.5066* |
| 2 | -6.2768 | -5.2379 | -5.8662 | |
| 3 | -5.8112 | -4.6214 | -5.3396 | |
| 东部 | 1 | -6.4896* | -5.6990* | -6.1687* |
| 2 | -6.2539 | -5.2482 | -5.8454 | |
| 3 | -6.3093 | -5.0662 | -5.8042 | |
| 中部 | 1 | -7.8650* | -7.0985* | -7.5537* |
| 2 | -6.9255 | -5.9061 | -6.5119 | |
| 3 | -3.4839 | -2.1872 | -2.9586 | |
| 西部 | 1 | -5.7601* | -4.9695* | -5.4392* |
| 2 | -5.0004 | -3.9946 | -4.5919 | |
| 3 | -3.9099 | -2.6667 | -3.4047 |
| 注:*表示在该准则下的最优滞后阶数。 |
表5 PVAR模型GMM估计结果Table 5 The results of GMM estimation based on PVAR model |
| 变量 | 区域 | lnINNO | lnIS | lnCEF |
|---|---|---|---|---|
| L. lnINNO | 全国 | 0.6286*** (-8.8339) | 0.1183*** (-1.5559) | 0.4247*** (-7.1227) |
| 东部 | 0.7277*** (-8.9029) | 0.1268*** (-1.5348) | 0.6025*** (-4.3786) | |
| 中部 | 0.2468*** (-1.2720) | 0.5072*** (-2.5542) | 0.6588*** (-4.1325) | |
| 西部 | 0.0852 (-0.2592) | 0.9121 (-2.7161) | 0.8082*** (-3.4448) | |
| L. lnIS | 全国 | 0.2424*** (-4.2494) | 1.0055*** (-16.0422) | 0.4283*** (-9.2186) |
| 东部 | 0.1480*** (-2.7887) | 1.7763*** (-13.014) | 0.5848*** (-6.6336) | |
| 中部 | 0.0611*** (-1.0257) | 0.6001 (-10.254) | 0.5972*** (-7.6057) | |
| 西部 | 0.9385 (-2.7760) | 0.7716 (-5.1722) | 0.8155 (-3.3404) | |
| L. lnCEF | 全国 | 0.0615* (-1.7881) | 0.0148 (-0.4023) | 0.9865*** (-25.0555) |
| 东部 | 0.0348 (-0.8969) | -0.0794* (-1.7701) | 1.0963*** (-11.8905) | |
| 中部 | 0.0319 (-0.5287) | -0.0782 (-1.2926) | 0.9386*** (-11.8641) | |
| 西部 | 0.2001 (-1.4414) | 0.1793 (-1.2998) | 1.0325*** (-8.9207) |
| 注:*p<0.1、**p<0.05、***p<0.01,括号内是该统计量的t检验值。 |
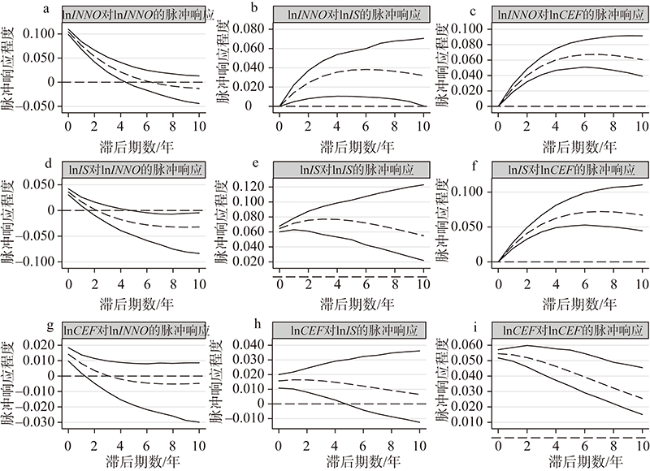
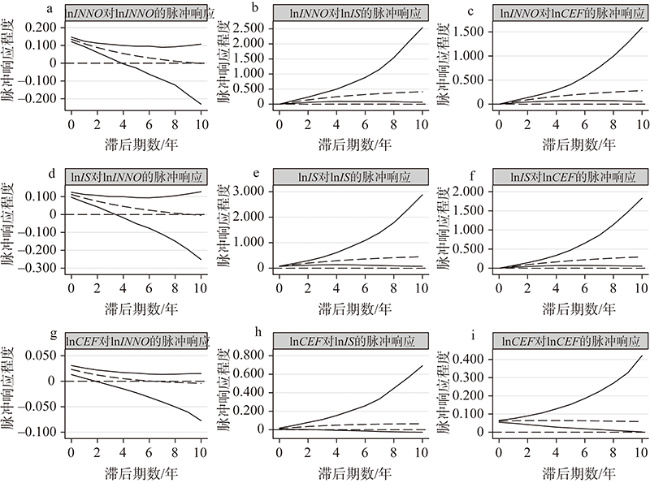
图2 全国脉冲响应注:蒙特卡罗法产生的每侧误差为5%,重复200次。中间虚线为脉冲响应曲线,虚线上下方的两条曲线分别为95%置信区间的上线和下线,下同。Fig. 2 National impulse response chart |
表6 PVAR模型方差分解结果Table 6 Variance decomposition results of PVAR model |
| 响应变量 | 冲击变量 | ||||
|---|---|---|---|---|---|
| 预测期 | lnINNO | lnIS | lnCEF | ||
| 全国 | lnINNO | 10 | 0.490 | 0.160 | 0.350 |
| lnINNO | 20 | 0.569 | 0.166 | 0.265 | |
| lnINNO | 30 | 0.575 | 0.164 | 0.261 | |
| lnIS | 10 | 0.070 | 0.554 | 0.376 | |
| lnIS | 20 | 0.094 | 0.469 | 0.437 | |
| lnIS | 30 | 0.097 | 0.459 | 0.444 | |
| lnCEF | 10 | 0.018 | 0.084 | 0.898 | |
| lnCEF | 20 | 0.020 | 0.079 | 0.901 | |
| lnCEF | 30 | 0.020 | 0.080 | 0.900 | |
| 东部 | lnINNO | 10 | 0.538 | 0.003 | 0.458 |
| lnINNO | 20 | 0.582 | 0.021 | 0.396 | |
| lnINNO | 30 | 0.573 | 0.031 | 0.395 | |
| lnIS | 10 | 0.024 | 0.654 | 0.322 | |
| lnIS | 20 | 0.020 | 0.723 | 0.257 | |
| lnIS | 30 | 0.022 | 0.719 | 0.259 | |
| lnCEF | 10 | 0.038 | 0.051 | 0.911 | |
| lnCEF | 20 | 0.045 | 0.060 | 0.896 | |
| lnCEF | 30 | 0.048 | 0.065 | 0.887 | |
| 中部 | lnINNO | 10 | 0.750 | 0.139 | 0.111 |
| lnINNO | 20 | 0.732 | 0.174 | 0.094 | |
| lnINNO | 30 | 0.727 | 0.176 | 0.097 | |
| lnIS | 10 | 0.134 | 0.654 | 0.211 | |
| lnIS | 20 | 0.190 | 0.587 | 0.223 | |
| lnIS | 30 | 0.198 | 0.578 | 0.224 | |
| lnCEF | 10 | 0.043 | 0.035 | 0.922 | |
| lnCEF | 20 | 0.067 | 0.052 | 0.881 | |
| lnCEF | 30 | 0.070 | 0.054 | 0.877 | |
| 西部 | lnINNO | 10 | 0.661 | 0.045 | 0.294 |
| lnINNO | 20 | 0.671 | 0.013 | 0.317 | |
| lnINNO | 30 | 0.667 | 0.009 | 0.325 | |
| lnIS | 10 | 0.025 | 0.715 | 0.260 | |
| lnIS | 20 | 0.008 | 0.691 | 0.301 | |
| lnIS | 30 | 0.006 | 0.679 | 0.315 | |
| lnCEF | 10 | 0.017 | 0.377 | 0.605 | |
| lnCEF | 20 | 0.010 | 0.485 | 0.504 | |
| lnCEF | 30 | 0.009 | 0.524 | 0.466 | |
| [1] |
{{custom_citation.content}}
{{custom_citation.annotation}}
|
| [2] |
{{custom_citation.content}}
{{custom_citation.annotation}}
|
| [3] |
姜海宁, 张文忠, 余建辉, 等. 山西资源型城市创新环境与产业结构转型空间耦合. 自然资源学报, 2020,35(2):269-283.
[
{{custom_citation.content}}
{{custom_citation.annotation}}
|
| [4] |
王慧艳, 李新运, 徐银良, 等. 科技创新与产业升级互动关系研究: 基于双向贡献率的测算. 统计与信息论坛, 2019,34(11):75-81.
[
{{custom_citation.content}}
{{custom_citation.annotation}}
|
| [5] |
李政, 杨思莹. 科技创新、产业升级与经济增长: 互动机理与实证检验. 吉林大学社会科学学报, 2017, 57(3): 41-52, 204-205.
[
{{custom_citation.content}}
{{custom_citation.annotation}}
|
| [6] |
{{custom_citation.content}}
{{custom_citation.annotation}}
|
| [7] |
{{custom_citation.content}}
{{custom_citation.annotation}}
|
| [8] |
金培振, 张亚斌, 彭星. 技术进步在二氧化碳减排中的双刃效应: 基于中国工业35个行业的经验证据. 科学学研究, 2014,32(5):706-716.
[
{{custom_citation.content}}
{{custom_citation.annotation}}
|
| [9] |
{{custom_citation.content}}
{{custom_citation.annotation}}
|
| [10] |
程钰, 孙艺璇, 王鑫静, 等. 全球科技创新对碳生产率的影响与对策研究. 中国人口·资源与环境, 2019,29(9):30-40.
[
{{custom_citation.content}}
{{custom_citation.annotation}}
|
| [11] |
王鑫静, 程钰, 丁立, 等. “一带一路”沿线国家科技创新对碳排放效率的影响机制研究. 软科学, 2019,33(6):72-78.
[
{{custom_citation.content}}
{{custom_citation.annotation}}
|
| [12] |
张玉华, 张涛. 改革开放以来科技创新、城镇化与碳排放. 中国科技论坛, 2019 (4):28-34, 57.
[
{{custom_citation.content}}
{{custom_citation.annotation}}
|
| [13] |
{{custom_citation.content}}
{{custom_citation.annotation}}
|
| [14] |
{{custom_citation.content}}
{{custom_citation.annotation}}
|
| [15] |
王钊, 王良虎. R&D投入、产业结构升级与碳排放关系研究. 工业技术经济, 2019,38(5):62-70.
[
{{custom_citation.content}}
{{custom_citation.annotation}}
|
| [16] |
周迪, 王雪芹. 中国碳排放效率与产业结构升级的耦合度及耦合路径. 自然资源学报, 2019,34(11):2305-2316.
[
{{custom_citation.content}}
{{custom_citation.annotation}}
|
| [17] |
田泽, 景晓栋, 肖钦文. 长江经济带碳排放—产业结构—区域创新耦合度及时空演化. 华东经济管理, 2020,34(2):10-17.
[
{{custom_citation.content}}
{{custom_citation.annotation}}
|
| [18] |
{{custom_citation.content}}
{{custom_citation.annotation}}
|
| [19] |
李金铠, 马静静, 魏伟. 中国八大综合经济区能源碳排放效率的区域差异研究. 数量经济技术经济研究, 2020,37(6):109-129.
[
{{custom_citation.content}}
{{custom_citation.annotation}}
|
| [20] |
原嫄, 席强敏, 李国平. 产业关联水平对碳排放演化的影响机理及效应研究: 基于欧盟27国投入产出数据的实证分析. 自然资源学报, 2017,32(5):841-853.
[
{{custom_citation.content}}
{{custom_citation.annotation}}
|
| [21] |
周亚军, 吉萍. 产业升级、金融资源配置效率对碳排放的影响研究: 基于省级空间面板数据分析. 华东经济管理, 2019,33(12):59-68.
[
{{custom_citation.content}}
{{custom_citation.annotation}}
|
| [22] |
张军. 要素成本、科技创新与产业结构升级. 证券市场导报, 2019, (11):24-31.
[
{{custom_citation.content}}
{{custom_citation.annotation}}
|
| [23] |
郭爱君, 杨春林, 钟方雷. 我国区域科技创新与生态环境优化耦合协调的时空格局及驱动因素分析. 科技管理研究, 2020,40(24):91-102.
[
{{custom_citation.content}}
{{custom_citation.annotation}}
|
| [24] |
高晓光, 苟凌宾. 西藏区域创新能力影响因素实证研究. 西藏民族大学学报: 哲学社会科学版, 2019,40(4):144-149.
[
{{custom_citation.content}}
{{custom_citation.annotation}}
|
| [25] |
朱金生, 李蝶. 环境规制、技术创新与就业增长的内在联系: 基于中国34个细分工业行业PVAR模型的实证检验. 人口与经济, 2020, (3):123-141.
[
{{custom_citation.content}}
{{custom_citation.annotation}}
|
| [26] |
干春晖, 郑若谷, 余典范. 中国产业结构变迁对经济增长和波动的影响. 经济研究, 2011,46(5):4-16, 31.
[
{{custom_citation.content}}
{{custom_citation.annotation}}
|
| [27] |
郭彬, 张笑. 金融集聚与产业结构升级耦合协调性研究. 管理现代化, 2018,38(5):31-34.
[
{{custom_citation.content}}
{{custom_citation.annotation}}
|
| [28] |
张军, 吴桂英, 张吉鹏. 中国省际物质资本存量估算: 1952—2000. 经济研究, 2004, (10):35-44.
[
{{custom_citation.content}}
{{custom_citation.annotation}}
|
| [29] |
连玉君, 苏治. 融资约束、不确定性与上市公司投资效率. 管理评论, 2009,21(1):19-26.
[
{{custom_citation.content}}
{{custom_citation.annotation}}
|
| {{custom_ref.label}} |
{{custom_citation.content}}
{{custom_citation.annotation}}
|


 PDF(2917 KB)
/
| 〈 |
|
〉 |

 AI Summary


