基于格点数据的中国1961—2016年≥5 ℃、≥10 ℃有效积温时空演变
 , 张勃, 马彬, 候启, 何航
 Spatiotemporal evolution of effective accumulated temperatures of ≥5 ℃ and ≥10 ℃ based on grid data in China from 1961 to 2016
基于格点数据的中国1961—2016年≥5 ℃、≥10 ℃有效积温时空演变 |
|
李帅, 张勃, 马彬, 候启, 何航 |
Spatiotemporal evolution of effective accumulated temperatures of ≥5 ℃ and ≥10 ℃ based on grid data in China from 1961 to 2016 |
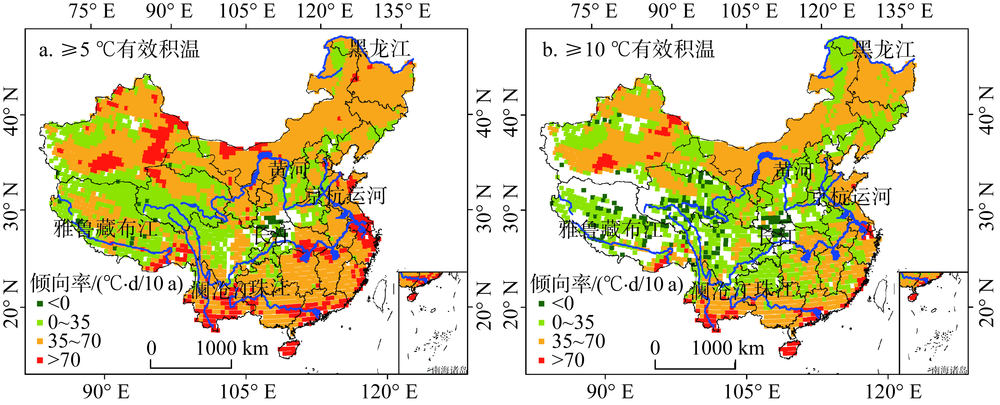
| ≥5 ℃、≥10 ℃有效积温气候倾向率空间分布 注:本图基于国家测绘地理信息局标准地图服务网站下载的审图号为GS(2016)28858号的标准地图制作,底图无修改,下同。 |
| Spatial distribution of climate tendency rate of effective accumulative temperature on the basis of ≥5 ℃ and ≥ 10 ℃ |
| |